|
Download Data (XLS File) |
|
||||||||
|
||||||||
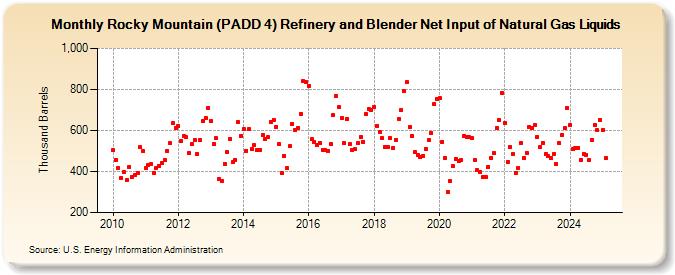
| Rocky Mountain (PADD 4) Refinery and Blender Net Input of Natural Gas Liquids (Thousand Barrels) | ||||||||
| Year | Jan | Feb | Mar | Apr | May | Jun | Jul | Aug | Sep | Oct | Nov | Dec |
|---|---|---|---|---|---|---|---|---|---|---|---|---|
| 2010 | 504 | 458 | 418 | 368 | 396 | 357 | 424 | 375 | 382 | 393 | 519 | 499 |
| 2011 | 419 | 431 | 435 | 395 | 416 | 427 | 443 | 458 | 502 | 537 | 635 | 611 |
| 2012 | 621 | 550 | 573 | 566 | 490 | 535 | 555 | 485 | 553 | 646 | 662 | 710 |
| 2013 | 647 | 536 | 562 | 364 | 356 | 437 | 494 | 560 | 445 | 458 | 641 | 575 |
| 2014 | 606 | 502 | 607 | 510 | 527 | 506 | 507 | 577 | 560 | 567 | 641 | 653 |
| 2015 | 618 | 534 | 393 | 478 | 417 | 523 | 633 | 602 | 614 | 681 | 842 | 835 |
| 2016 | 819 | 558 | 542 | 531 | 539 | 504 | 504 | 500 | 536 | 675 | 767 | 714 |
| 2017 | 662 | 537 | 657 | 532 | 505 | 508 | 537 | 567 | 546 | 680 | 703 | 700 |
| 2018 | 716 | 624 | 591 | 561 | 521 | 521 | 561 | 517 | 555 | 657 | 699 | 791 |
| 2019 | 834 | 617 | 575 | 495 | 480 | 472 | 476 | 510 | 553 | 590 | 729 | 754 |
| 2020 | 757 | 546 | 468 | 300 | 352 | 425 | 463 | 451 | 456 | 574 | 568 | 566 |
| 2021 | 563 | 456 | 405 | 398 | 373 | 371 | 424 | 468 | 490 | 613 | 652 | 784 |
| 2022 | 638 | 446 | 520 | 485 | 392 | 419 | 540 | 468 | 491 | 618 | 610 | 627 |
| 2023 | 568 | 520 | 541 | 485 | 475 | 464 | 486 | 439 | 537 | 578 | 611 | 710 |
| 2024 | 629 | 512 | 514 | 516 | 458 | 486 | 481 | 457 | 554 | 626 | 602 | 653 |
| 2025 | 603 | 465 | 510 | 483 | ||||||||
| - = No Data Reported; -- = Not Applicable; NA = Not Available; W = Withheld to avoid disclosure of individual company data. |
| Release Date: 6/30/2025 |
| Next Release Date: 7/31/2025 |