|
Download Data (XLS File) |
|
||||||||
|
||||||||
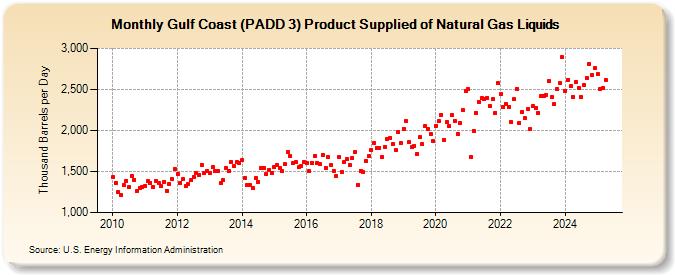
| Gulf Coast (PADD 3) Product Supplied of Natural Gas Liquids (Thousand Barrels per Day) | ||||||||
| Year | Jan | Feb | Mar | Apr | May | Jun | Jul | Aug | Sep | Oct | Nov | Dec |
|---|---|---|---|---|---|---|---|---|---|---|---|---|
| 2010 | 1,431 | 1,358 | 1,250 | 1,209 | 1,334 | 1,385 | 1,307 | 1,450 | 1,400 | 1,257 | 1,302 | 1,315 |
| 2011 | 1,327 | 1,379 | 1,363 | 1,314 | 1,390 | 1,366 | 1,321 | 1,378 | 1,266 | 1,345 | 1,405 | 1,532 |
| 2012 | 1,471 | 1,364 | 1,403 | 1,326 | 1,348 | 1,393 | 1,435 | 1,479 | 1,462 | 1,581 | 1,478 | 1,508 |
| 2013 | 1,483 | 1,550 | 1,503 | 1,512 | 1,355 | 1,391 | 1,544 | 1,507 | 1,617 | 1,562 | 1,620 | 1,601 |
| 2014 | 1,636 | 1,423 | 1,333 | 1,331 | 1,296 | 1,418 | 1,378 | 1,546 | 1,543 | 1,464 | 1,519 | 1,486 |
| 2015 | 1,553 | 1,580 | 1,538 | 1,502 | 1,588 | 1,734 | 1,686 | 1,600 | 1,611 | 1,551 | 1,568 | 1,617 |
| 2016 | 1,607 | 1,506 | 1,608 | 1,691 | 1,604 | 1,591 | 1,707 | 1,547 | 1,671 | 1,575 | 1,510 | 1,448 |
| 2017 | 1,674 | 1,498 | 1,619 | 1,648 | 1,575 | 1,665 | 1,738 | 1,339 | 1,510 | 1,497 | 1,629 | 1,686 |
| 2018 | 1,768 | 1,845 | 1,788 | 1,791 | 1,675 | 1,799 | 1,893 | 1,910 | 1,831 | 1,761 | 1,976 | 1,845 |
| 2019 | 2,022 | 2,115 | 1,854 | 1,796 | 1,811 | 1,716 | 1,916 | 1,835 | 2,053 | 2,021 | 1,958 | 1,867 |
| 2020 | 2,057 | 2,110 | 2,192 | 1,885 | 2,103 | 2,052 | 2,188 | 2,116 | 1,959 | 2,088 | 2,247 | 2,482 |
| 2021 | 2,504 | 1,674 | 1,999 | 2,218 | 2,352 | 2,392 | 2,387 | 2,401 | 2,299 | 2,379 | 2,216 | 2,573 |
| 2022 | 2,444 | 2,280 | 2,327 | 2,291 | 2,101 | 2,380 | 2,510 | 2,093 | 2,226 | 2,148 | 2,263 | 2,016 |
| 2023 | 2,140 | 2,083 | 2,195 | 2,384 | 2,410 | 2,510 | 2,560 | 2,348 | 2,235 | 2,550 | 2,538 | 2,790 |
| 2024 | 2,484 | 2,617 | 2,537 | 2,408 | ||||||||
| - = No Data Reported; -- = Not Applicable; NA = Not Available; W = Withheld to avoid disclosure of individual company data. |
| Release Date: 6/28/2024 |
| Next Release Date: 7/31/2024 |