|
Download Data (XLS File) |
|
||||||||
|
||||||||
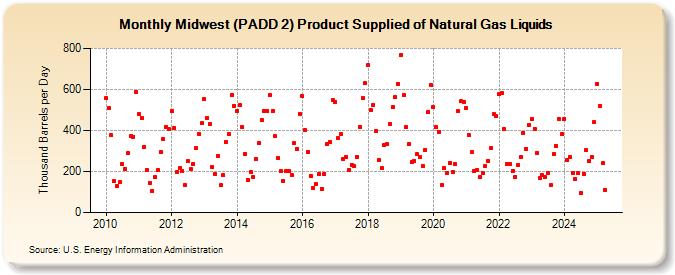
| Midwest (PADD 2) Product Supplied of Natural Gas Liquids (Thousand Barrels per Day) | ||||||||
| Year | Jan | Feb | Mar | Apr | May | Jun | Jul | Aug | Sep | Oct | Nov | Dec |
|---|---|---|---|---|---|---|---|---|---|---|---|---|
| 2010 | 556 | 508 | 376 | 152 | 129 | 147 | 236 | 212 | 288 | 373 | 370 | 589 |
| 2011 | 481 | 463 | 320 | 207 | 145 | 105 | 172 | 206 | 294 | 358 | 418 | 405 |
| 2012 | 496 | 413 | 197 | 216 | 202 | 132 | 249 | 212 | 238 | 313 | 384 | 434 |
| 2013 | 554 | 461 | 431 | 220 | 187 | 276 | 132 | 181 | 344 | 384 | 572 | 521 |
| 2014 | 497 | 524 | 417 | 286 | 160 | 196 | 174 | 259 | 339 | 453 | 494 | 495 |
| 2015 | 574 | 496 | 372 | 268 | 202 | 153 | 201 | 201 | 184 | 337 | 312 | 481 |
| 2016 | 567 | 400 | 297 | 180 | 119 | 137 | 189 | 117 | 190 | 334 | 344 | 548 |
| 2017 | 541 | 362 | 382 | 263 | 272 | 205 | 233 | 226 | 271 | 418 | 557 | 631 |
| 2018 | 717 | 498 | 523 | 397 | 258 | 218 | 328 | 335 | 432 | 512 | 563 | 628 |
| 2019 | 766 | 573 | 416 | 334 | 245 | 253 | 284 | 272 | 226 | 307 | 490 | 620 |
| 2020 | 513 | 415 | 395 | 133 | 215 | 194 | 243 | 196 | 235 | 494 | 542 | 539 |
| 2021 | 510 | 376 | 293 | 201 | 208 | 173 | 195 | 229 | 253 | 313 | 480 | 469 |
| 2022 | 579 | 584 | 405 | 236 | 235 | 204 | 175 | 231 | 270 | 390 | 312 | 429 |
| 2023 | 458 | 402 | 329 | 194 | 191 | 206 | 194 | 147 | 293 | 325 | 457 | 415 |
| 2024 | 456 | 257 | 274 | 201 | ||||||||
| - = No Data Reported; -- = Not Applicable; NA = Not Available; W = Withheld to avoid disclosure of individual company data. |
| Release Date: 6/28/2024 |
| Next Release Date: 7/31/2024 |