|
Download Data (XLS File) |
|
||||||||
|
||||||||
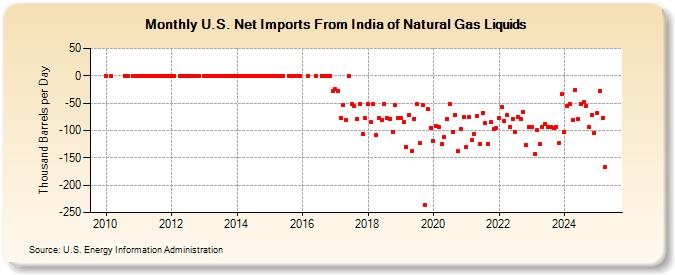
| U.S. Net Imports From India of Natural Gas Liquids (Thousand Barrels per Day) | ||||||||
| Year | Jan | Feb | Mar | Apr | May | Jun | Jul | Aug | Sep | Oct | Nov | Dec |
|---|---|---|---|---|---|---|---|---|---|---|---|---|
| 2010 | 0 | 0 | 0 | 0 | 0 | 0 | ||||||
| 2011 | 0 | 0 | 0 | 0 | 0 | 0 | 0 | 0 | 0 | 0 | 0 | 0 |
| 2012 | 0 | 0 | 0 | 0 | 0 | 0 | 0 | 0 | 0 | 0 | ||
| 2013 | 0 | 0 | 0 | 0 | 0 | 0 | 0 | 0 | 0 | 0 | 0 | 0 |
| 2014 | 0 | 0 | 0 | 0 | 0 | 0 | 0 | 0 | 0 | 0 | 0 | 0 |
| 2015 | 0 | 0 | 0 | 0 | 0 | 0 | 0 | 0 | 0 | 0 | 0 | |
| 2016 | 0 | 0 | 0 | 0 | 0 | 0 | -27 | |||||
| 2017 | -25 | -28 | -77 | -53 | -80 | 0 | -51 | -56 | -79 | -51 | -106 | -77 |
| 2018 | -51 | -85 | -51 | -108 | -77 | -81 | -51 | -77 | -79 | -102 | -53 | -77 |
| 2019 | -77 | -85 | -130 | -71 | -138 | -79 | -51 | -122 | -53 | -236 | -61 | -95 |
| 2020 | -120 | -91 | -94 | -125 | -112 | -79 | -51 | -102 | -71 | -138 | -97 | -76 |
| 2021 | -130 | -75 | -118 | -107 | -73 | -124 | -68 | -86 | -124 | -85 | -98 | -95 |
| 2022 | -77 | -57 | -83 | -71 | -93 | -79 | -102 | -76 | -79 | -67 | -127 | -94 |
| 2023 | -94 | -143 | -100 | -124 | -93 | -88 | -93 | -94 | -96 | -94 | -123 | -34 |
| 2024 | -102 | -55 | -51 | -80 | -26 | -79 | ||||||
| - = No Data Reported; -- = Not Applicable; NA = Not Available; W = Withheld to avoid disclosure of individual company data. |
| Release Date: 8/30/2024 |
| Next Release Date: 9/30/2024 |