|
Download Data (XLS File) |
|
||||||||
|
||||||||
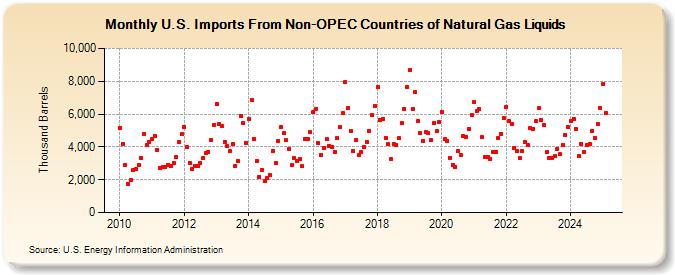
| U.S. Imports From Non-OPEC Countries of Natural Gas Liquids (Thousand Barrels) | ||||||||
| Year | Jan | Feb | Mar | Apr | May | Jun | Jul | Aug | Sep | Oct | Nov | Dec |
|---|---|---|---|---|---|---|---|---|---|---|---|---|
| 2010 | 5,125 | 4,153 | 2,883 | 1,763 | 1,988 | 2,569 | 2,645 | 2,917 | 3,295 | 4,811 | 4,138 | 4,315 |
| 2011 | 4,489 | 4,651 | 3,798 | 2,732 | 2,792 | 2,771 | 2,920 | 2,830 | 3,017 | 3,408 | 4,274 | 4,763 |
| 2012 | 5,223 | 3,993 | 3,046 | 2,645 | 2,846 | 2,828 | 3,027 | 3,293 | 3,620 | 3,719 | 4,437 | 5,338 |
| 2013 | 6,599 | 5,399 | 5,289 | 4,325 | 4,030 | 3,731 | 4,162 | 2,820 | 3,146 | 5,886 | 5,464 | 4,257 |
| 2014 | 5,706 | 6,884 | 4,487 | 3,164 | 2,194 | 2,593 | 1,949 | 2,121 | 2,265 | 3,734 | 3,047 | 4,353 |
| 2015 | 5,186 | 4,816 | 4,395 | 3,842 | 2,903 | 3,302 | 3,149 | 3,240 | 2,841 | 4,463 | 4,454 | 4,885 |
| 2016 | 6,105 | 6,330 | 4,208 | 3,528 | 3,930 | 4,474 | 4,056 | 3,986 | 3,716 | 4,521 | 5,239 | 6,044 |
| 2017 | 7,947 | 6,376 | 4,995 | 3,764 | 4,416 | 3,498 | 3,677 | 4,019 | 4,283 | 4,981 | 5,936 | 6,494 |
| 2018 | 7,655 | 5,648 | 5,716 | 4,558 | 4,165 | 3,241 | 4,172 | 4,125 | 4,524 | 5,451 | 6,324 | 7,644 |
| 2019 | 8,691 | 6,321 | 7,320 | 5,550 | 4,818 | 4,358 | 4,929 | 4,827 | 4,407 | 5,442 | 4,971 | 5,524 |
| 2020 | 6,124 | 4,466 | 4,380 | 3,341 | 2,925 | 2,779 | 3,720 | 3,508 | 4,674 | 4,613 | 5,111 | 5,923 |
| 2021 | 6,717 | 6,177 | 6,302 | 4,574 | 3,377 | 3,367 | 3,283 | 3,714 | 3,690 | 4,546 | 4,788 | 5,736 |
| 2022 | 6,452 | 5,590 | 5,407 | 3,956 | 3,723 | 3,309 | 3,739 | 4,284 | 4,112 | 5,142 | 5,105 | 5,553 |
| 2023 | 6,248 | 5,587 | 5,383 | 3,545 | 3,362 | 3,314 | 3,451 | 3,857 | 3,550 | 4,158 | 4,736 | 5,238 |
| 2024 | 5,569 | 5,726 | 5,060 | 3,451 | ||||||||
| - = No Data Reported; -- = Not Applicable; NA = Not Available; W = Withheld to avoid disclosure of individual company data. |
| Release Date: 6/28/2024 |
| Next Release Date: 7/31/2024 |