|
Download Data (XLS File) |
|
||||||||
|
||||||||
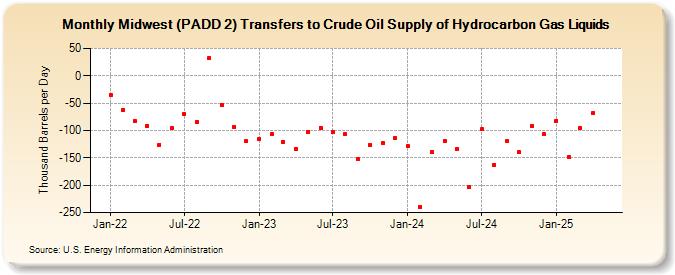
| Midwest (PADD 2) Transfers to Crude Oil Supply of Hydrocarbon Gas Liquids (Thousand Barrels per Day) | ||||||||
| Year | Jan | Feb | Mar | Apr | May | Jun | Jul | Aug | Sep | Oct | Nov | Dec |
|---|---|---|---|---|---|---|---|---|---|---|---|---|
| 2022 | -35 | -62 | -82 | -91 | -126 | -96 | -69 | -84 | 32 | -54 | -93 | -120 |
| 2023 | -117 | -119 | -137 | -130 | -222 | -204 | -164 | -199 | -226 | -206 | -125 | -114 |
| 2024 | -128 | -239 | -140 | -119 | ||||||||
| - = No Data Reported; -- = Not Applicable; NA = Not Available; W = Withheld to avoid disclosure of individual company data. |
| Release Date: 6/28/2024 |
| Next Release Date: 7/31/2024 |