|
Download Data (XLS File) |
|
||||||||
|
||||||||
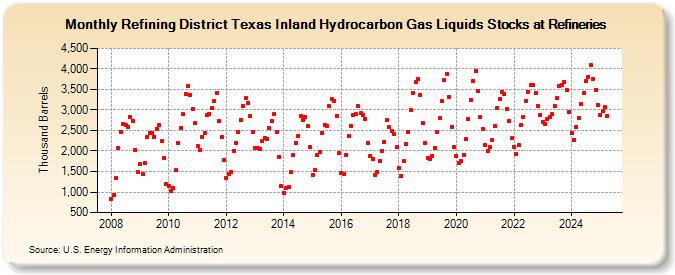
| Refining District Texas Inland Hydrocarbon Gas Liquids Stocks at Refineries (Thousand Barrels) | ||||||||
| Year | Jan | Feb | Mar | Apr | May | Jun | Jul | Aug | Sep | Oct | Nov | Dec |
|---|---|---|---|---|---|---|---|---|---|---|---|---|
| 2008 | 830 | 922 | 1,346 | 2,066 | 2,466 | 2,648 | 2,644 | 2,587 | 2,820 | 2,743 | 2,022 | 1,493 |
| 2009 | 1,680 | 1,448 | 1,717 | 2,330 | 2,447 | 2,430 | 2,352 | 2,543 | 2,644 | 2,234 | 1,830 | 1,189 |
| 2010 | 1,151 | 1,019 | 1,090 | 1,535 | 2,190 | 2,552 | 2,894 | 3,395 | 3,577 | 3,369 | 3,029 | 2,672 |
| 2011 | 2,111 | 2,029 | 2,345 | 2,448 | 2,875 | 2,911 | 3,039 | 3,215 | 3,422 | 2,731 | 2,344 | 1,779 |
| 2012 | 1,353 | 1,432 | 1,492 | 2,003 | 2,189 | 2,460 | 2,766 | 3,094 | 3,288 | 3,168 | 2,847 | 2,472 |
| 2013 | 2,066 | 2,065 | 2,056 | 2,242 | 2,313 | 2,304 | 2,556 | 2,734 | 2,909 | 2,462 | 1,860 | 1,137 |
| 2014 | 975 | 1,104 | 1,121 | 1,481 | 1,908 | 2,188 | 2,373 | 2,846 | 2,744 | 2,834 | 2,606 | 2,096 |
| 2015 | 1,413 | 1,528 | 1,894 | 1,964 | 2,428 | 2,632 | 2,612 | 3,085 | 3,258 | 3,229 | 2,863 | 1,946 |
| 2016 | 1,471 | 1,443 | 1,914 | 2,359 | 2,611 | 2,873 | 2,912 | 3,093 | 2,914 | 2,887 | 2,776 | 2,198 |
| 2017 | 1,876 | 1,796 | 1,413 | 1,491 | 1,756 | 2,007 | 2,221 | 2,756 | 2,575 | 2,491 | 2,413 | 2,102 |
| 2018 | 1,580 | 1,390 | 1,754 | 2,182 | 2,453 | 3,007 | 3,414 | 3,682 | 3,757 | 3,362 | 2,694 | 2,201 |
| 2019 | 1,835 | 1,810 | 1,889 | 2,081 | 2,469 | 2,805 | 3,216 | 3,721 | 3,880 | 3,326 | 2,579 | 2,092 |
| 2020 | 1,879 | 1,714 | 1,757 | 1,912 | 2,288 | 2,780 | 3,245 | 3,717 | 3,961 | 3,461 | 2,820 | 2,536 |
| 2021 | 2,137 | 1,992 | 2,106 | 2,263 | 2,600 | 3,048 | 3,269 | 3,445 | 3,387 | 3,017 | 2,742 | 2,310 |
| 2022 | 2,101 | 1,926 | 2,154 | 2,631 | 2,831 | 3,219 | 3,446 | 3,597 | 3,601 | 3,405 | 3,108 | 2,888 |
| 2023 | 2,707 | 2,654 | 2,782 | 2,833 | 2,892 | 3,093 | 3,282 | 3,576 | 3,603 | 3,691 | 3,488 | 2,955 |
| 2024 | 2,434 | 2,268 | 2,576 | 2,812 | ||||||||
| - = No Data Reported; -- = Not Applicable; NA = Not Available; W = Withheld to avoid disclosure of individual company data. |
| Release Date: 6/28/2024 |
| Next Release Date: 7/31/2024 |
Referring Pages: