|
Download Data (XLS File) |
|
||||||||
|
||||||||
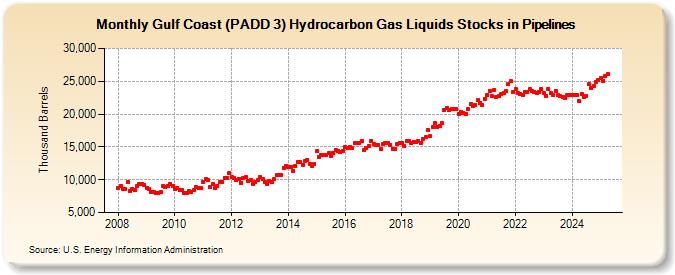
| Gulf Coast (PADD 3) Hydrocarbon Gas Liquids Stocks in Pipelines (Thousand Barrels) | ||||||||
| Year | Jan | Feb | Mar | Apr | May | Jun | Jul | Aug | Sep | Oct | Nov | Dec |
|---|---|---|---|---|---|---|---|---|---|---|---|---|
| 2008 | 8,746 | 9,088 | 8,532 | 8,601 | 9,673 | 8,344 | 8,640 | 8,394 | 8,981 | 9,421 | 9,343 | 9,263 |
| 2009 | 8,795 | 8,653 | 8,151 | 8,132 | 7,928 | 8,014 | 8,132 | 9,015 | 8,821 | 9,079 | 9,398 | 8,996 |
| 2010 | 8,648 | 8,703 | 8,461 | 8,380 | 8,036 | 7,915 | 8,230 | 8,163 | 8,450 | 8,863 | 8,698 | 8,713 |
| 2011 | 9,696 | 10,108 | 10,007 | 8,913 | 9,339 | 8,728 | 9,099 | 9,668 | 9,719 | 10,304 | 10,325 | 10,968 |
| 2012 | 10,408 | 10,232 | 9,897 | 10,167 | 9,450 | 10,292 | 10,349 | 9,842 | 9,919 | 9,375 | 9,616 | 9,999 |
| 2013 | 10,451 | 10,102 | 9,631 | 9,356 | 9,809 | 9,594 | 10,071 | 10,731 | 10,738 | 10,756 | 11,843 | 12,087 |
| 2014 | 11,862 | 12,001 | 11,347 | 12,026 | 12,667 | 12,657 | 12,312 | 12,876 | 13,066 | 12,467 | 12,133 | 12,389 |
| 2015 | 14,326 | 13,501 | 13,814 | 13,794 | 13,804 | 14,022 | 13,672 | 14,022 | 14,516 | 14,323 | 14,273 | 14,393 |
| 2016 | 14,927 | 14,786 | 15,017 | 14,864 | 15,596 | 15,606 | 15,618 | 15,886 | 14,541 | 14,898 | 15,155 | 15,967 |
| 2017 | 15,515 | 15,253 | 15,356 | 14,745 | 15,471 | 15,575 | 15,541 | 15,313 | 14,711 | 14,659 | 15,409 | 15,603 |
| 2018 | 15,579 | 15,136 | 15,887 | 15,881 | 15,547 | 15,670 | 15,698 | 15,859 | 15,597 | 16,229 | 16,476 | 17,607 |
| 2019 | 16,641 | 18,015 | 18,598 | 18,003 | 18,175 | 18,632 | 20,548 | 20,901 | 20,568 | 20,708 | 20,799 | 20,789 |
| 2020 | 20,036 | 20,320 | 20,168 | 20,017 | 20,772 | 21,498 | 21,200 | 21,381 | 22,083 | 21,701 | 21,355 | 22,362 |
| 2021 | 22,968 | 23,562 | 22,749 | 23,716 | 22,578 | 22,786 | 23,054 | 23,186 | 23,497 | 24,513 | 25,005 | 23,346 |
| 2022 | 23,847 | 23,277 | 23,078 | 22,966 | 23,304 | 23,315 | 23,804 | 23,522 | 23,435 | 23,272 | 23,409 | 23,746 |
| 2023 | 23,221 | 22,799 | 23,920 | 23,173 | 22,892 | 23,630 | 23,029 | 22,743 | 24,721 | 22,478 | 23,029 | 22,978 |
| 2024 | 22,882 | 22,857 | 22,858 | 21,978 | ||||||||
| - = No Data Reported; -- = Not Applicable; NA = Not Available; W = Withheld to avoid disclosure of individual company data. |
| Release Date: 6/28/2024 |
| Next Release Date: 7/31/2024 |