|
Download Data (XLS File) |
|
||||||||
|
||||||||
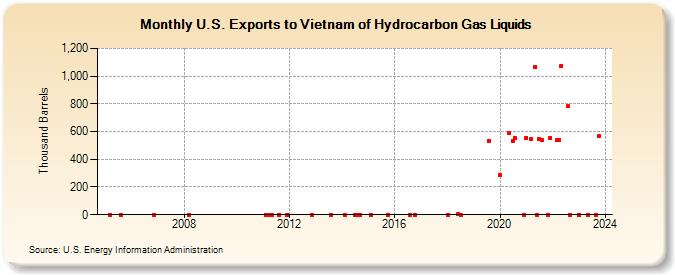
| U.S. Exports to Vietnam of Hydrocarbon Gas Liquids (Thousand Barrels) | ||||||||
| Year | Jan | Feb | Mar | Apr | May | Jun | Jul | Aug | Sep | Oct | Nov | Dec |
|---|---|---|---|---|---|---|---|---|---|---|---|---|
| 2005 | 1 | 1 | ||||||||||
| 2006 | 0 | |||||||||||
| 2008 | 0 | |||||||||||
| 2011 | 0 | 0 | 0 | 1 | 0 | |||||||
| 2012 | 0 | |||||||||||
| 2013 | 0 | |||||||||||
| 2014 | 0 | 0 | 1 | 0 | ||||||||
| 2015 | 0 | 0 | ||||||||||
| 2016 | 0 | 0 | ||||||||||
| 2018 | 0 | 4 | 0 | |||||||||
| 2019 | 534 | |||||||||||
| 2020 | 290 | 591 | 534 | 554 | 0 | |||||||
| 2021 | 557 | 543 | 1,068 | 0 | 546 | 539 | 0 | 557 | ||||
| 2022 | 537 | 540 | 1,073 | 781 | 1 | |||||||
| 2023 | 0 | 0 | 0 | 566 | ||||||||
| - = No Data Reported; -- = Not Applicable; NA = Not Available; W = Withheld to avoid disclosure of individual company data. |
| Release Date: 3/29/2024 |
| Next Release Date: 4/30/2024 |