|
Download Data (XLS File) |
|
||||||||
|
||||||||
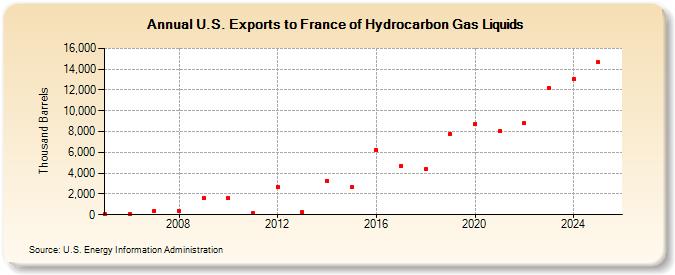
| U.S. Exports to France of Hydrocarbon Gas Liquids (Thousand Barrels) | ||||||||
| Decade | Year-0 | Year-1 | Year-2 | Year-3 | Year-4 | Year-5 | Year-6 | Year-7 | Year-8 | Year-9 |
|---|---|---|---|---|---|---|---|---|---|---|
| 2000's | 27 | 42 | 401 | 401 | 1,613 | |||||
| 2010's | 1,626 | 199 | 2,696 | 256 | 3,278 | 2,637 | 6,203 | 4,701 | 4,355 | 7,742 |
| 2020's | 8,737 | 8,059 | 8,797 | 11,151 |
| - = No Data Reported; -- = Not Applicable; NA = Not Available; W = Withheld to avoid disclosure of individual company data. |
| Release Date: 6/28/2024 |
| Next Release Date: 8/30/2024 |