|
Download Data (XLS File) |
|
||||||||
|
||||||||
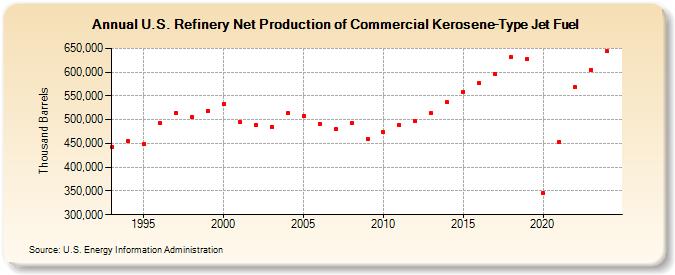
| U.S. Refinery Net Production of Commercial Kerosene-Type Jet Fuel (Thousand Barrels) | ||||||||
| Decade | Year-0 | Year-1 | Year-2 | Year-3 | Year-4 | Year-5 | Year-6 | Year-7 | Year-8 | Year-9 |
|---|---|---|---|---|---|---|---|---|---|---|
| 1990's | 442,403 | 455,329 | 449,225 | 492,262 | 514,552 | 505,507 | 518,986 | |||
| 2000's | 532,749 | 495,518 | 489,826 | 485,198 | 513,474 | 508,428 | 491,776 | 479,400 | 492,569 | 459,921 |
| 2010's | 473,508 | 488,395 | 496,293 | 513,556 | 536,619 | 559,227 | 576,517 | 595,472 | 631,872 | 626,964 |
| 2020's | 345,101 | 453,362 | 568,684 | 605,753 |
| - = No Data Reported; -- = Not Applicable; NA = Not Available; W = Withheld to avoid disclosure of individual company data. |
| Release Date: 6/28/2024 |
| Next Release Date: 8/30/2024 |