|
Download Data (XLS File) |
|
||||||||
|
||||||||
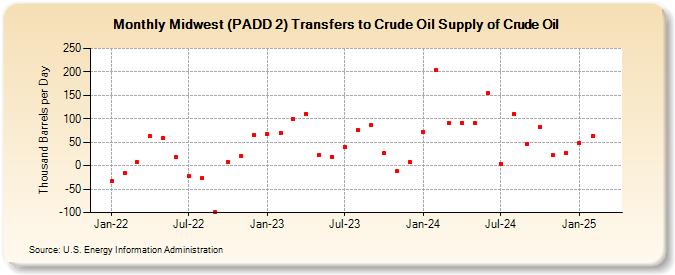
| Midwest (PADD 2) Transfers to Crude Oil Supply of Crude Oil (Thousand Barrels per Day) | ||||||||
| Year | Jan | Feb | Mar | Apr | May | Jun | Jul | Aug | Sep | Oct | Nov | Dec |
|---|---|---|---|---|---|---|---|---|---|---|---|---|
| 2022 | -33 | -16 | 8 | 63 | 58 | 19 | -23 | -27 | -98 | 8 | 20 | 66 |
| 2023 | 71 | 82 | 119 | 110 | 143 | 128 | 102 | 170 | 160 | 106 | -9 | 8 |
| 2024 | 72 | |||||||||||
| - = No Data Reported; -- = Not Applicable; NA = Not Available; W = Withheld to avoid disclosure of individual company data. |
| Release Date: 3/29/2024 |
| Next Release Date: 4/30/2024 |
Referring Pages: