|
Download Data (XLS File) |
|
||||||||
|
||||||||
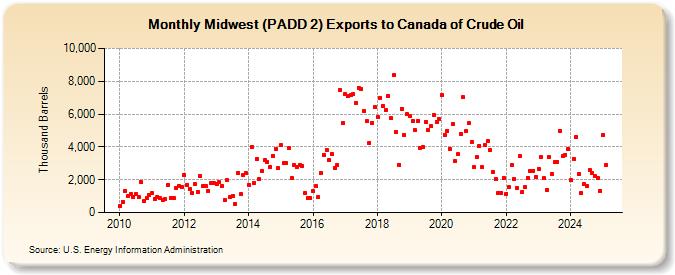
| Midwest (PADD 2) Exports to Canada of Crude Oil (Thousand Barrels) | ||||||||
| Year | Jan | Feb | Mar | Apr | May | Jun | Jul | Aug | Sep | Oct | Nov | Dec |
|---|---|---|---|---|---|---|---|---|---|---|---|---|
| 2010 | 409 | 665 | 1,326 | 989 | 1,120 | 936 | 1,123 | 932 | 1,838 | 681 | 905 | 1,072 |
| 2011 | 1,164 | 847 | 962 | 866 | 794 | 800 | 1,697 | 880 | 898 | 1,482 | 1,639 | 1,544 |
| 2012 | 2,295 | 1,707 | 1,423 | 1,180 | 1,720 | 1,282 | 2,205 | 1,590 | 1,631 | 1,318 | 1,829 | 1,784 |
| 2013 | 1,727 | 1,834 | 1,646 | 780 | 1,960 | 955 | 1,026 | 525 | 2,412 | 1,110 | 2,283 | 2,393 |
| 2014 | 1,685 | 3,995 | 1,795 | 3,277 | 2,034 | 2,541 | 3,179 | 3,081 | 2,779 | 3,475 | 3,854 | 2,701 |
| 2015 | 4,114 | 3,015 | 3,027 | 3,947 | 2,093 | 2,887 | 2,777 | 2,924 | 2,854 | 1,191 | 860 | 908 |
| 2016 | 1,289 | 1,591 | 953 | 2,394 | 3,507 | 3,805 | 3,212 | 3,591 | 2,723 | 2,889 | 7,479 | 5,451 |
| 2017 | 7,226 | 7,124 | 7,135 | 7,210 | 6,703 | 7,605 | 7,512 | 6,188 | 5,559 | 4,267 | 5,480 | 6,423 |
| 2018 | 5,834 | 6,964 | 6,511 | 6,228 | 7,114 | 5,753 | 8,365 | 4,927 | 2,915 | 6,336 | 4,731 | 5,977 |
| 2019 | 5,876 | 5,589 | 5,022 | 5,581 | 3,950 | 3,979 | 5,535 | 5,036 | 5,268 | 5,933 | 5,534 | 5,670 |
| 2020 | 7,150 | 4,737 | 4,972 | 3,900 | 5,386 | 3,136 | 3,540 | 4,790 | 7,012 | 4,955 | 5,455 | 4,296 |
| 2021 | 2,747 | 3,375 | 4,071 | 2,752 | 4,088 | 4,331 | 3,800 | 2,462 | 2,030 | 1,204 | 1,213 | 2,105 |
| 2022 | 1,160 | 1,540 | 2,881 | 2,036 | 1,511 | 3,440 | 1,259 | 1,532 | 2,126 | 2,545 | 2,556 | 2,173 |
| 2023 | 2,656 | 3,371 | 2,088 | 1,366 | 3,375 | 2,352 | 3,051 | 3,104 | 4,993 | 3,417 | 3,520 | 3,899 |
| 2024 | 1,972 | |||||||||||
| - = No Data Reported; -- = Not Applicable; NA = Not Available; W = Withheld to avoid disclosure of individual company data. |
| Release Date: 3/29/2024 |
| Next Release Date: 4/30/2024 |