|
Download Data (XLS File) |
|
||||||||
|
||||||||
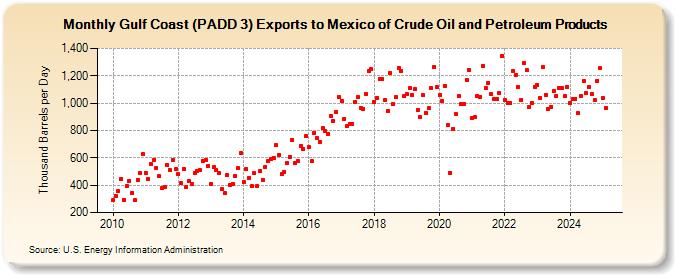
| Gulf Coast (PADD 3) Exports to Mexico of Crude Oil and Petroleum Products (Thousand Barrels per Day) | ||||||||
| Year | Jan | Feb | Mar | Apr | May | Jun | Jul | Aug | Sep | Oct | Nov | Dec |
|---|---|---|---|---|---|---|---|---|---|---|---|---|
| 2010 | 289 | 319 | 355 | 448 | 295 | 391 | 432 | 345 | 289 | 441 | 489 | 626 |
| 2011 | 489 | 446 | 552 | 587 | 524 | 464 | 377 | 387 | 544 | 512 | 587 | 516 |
| 2012 | 480 | 413 | 519 | 387 | 431 | 408 | 488 | 507 | 509 | 579 | 581 | 543 |
| 2013 | 410 | 530 | 510 | 490 | 374 | 341 | 472 | 403 | 412 | 468 | 524 | 635 |
| 2014 | 423 | 518 | 451 | 394 | 487 | 392 | 501 | 439 | 533 | 578 | 589 | 601 |
| 2015 | 691 | 621 | 479 | 500 | 561 | 608 | 733 | 563 | 580 | 688 | 664 | 756 |
| 2016 | 679 | 576 | 783 | 742 | 719 | 816 | 793 | 777 | 907 | 868 | 934 | 1,044 |
| 2017 | 1,018 | 886 | 830 | 844 | 847 | 1,006 | 1,044 | 963 | 957 | 1,069 | 1,236 | 1,246 |
| 2018 | 1,011 | 1,038 | 1,175 | 1,175 | 1,023 | 943 | 1,221 | 997 | 1,042 | 1,257 | 1,234 | 1,052 |
| 2019 | 1,064 | 1,110 | 1,058 | 1,102 | 953 | 899 | 1,058 | 930 | 964 | 1,112 | 1,263 | 1,118 |
| 2020 | 1,057 | 1,014 | 1,126 | 840 | 491 | 813 | 922 | 1,050 | 990 | 997 | 1,166 | 1,241 |
| 2021 | 892 | 896 | 1,054 | 1,048 | 1,272 | 1,114 | 1,149 | 1,064 | 1,032 | 1,028 | 1,071 | 1,346 |
| 2022 | 1,021 | 1,004 | 998 | 1,236 | 1,203 | 1,118 | 1,026 | 1,290 | 1,239 | 974 | 1,000 | 1,120 |
| 2023 | 1,079 | 1,094 | 1,322 | 1,003 | 950 | 1,002 | 1,102 | 1,029 | 1,122 | 1,112 | 1,040 | 1,116 |
| 2024 | 1,001 | 1,030 | 1,032 | 925 | ||||||||
| - = No Data Reported; -- = Not Applicable; NA = Not Available; W = Withheld to avoid disclosure of individual company data. |
| Release Date: 6/28/2024 |
| Next Release Date: 7/31/2024 |