|
Download Data (XLS File) |
|
||||||||
|
||||||||
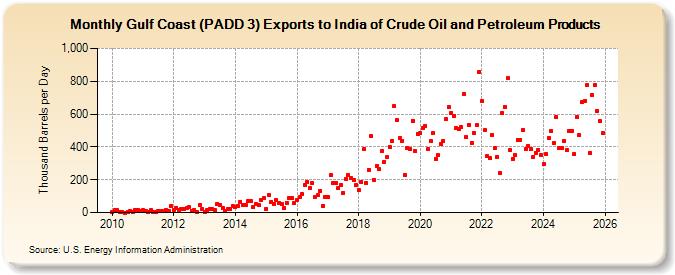
| Gulf Coast (PADD 3) Exports to India of Crude Oil and Petroleum Products (Thousand Barrels per Day) | ||||||||
| Year | Jan | Feb | Mar | Apr | May | Jun | Jul | Aug | Sep | Oct | Nov | Dec |
|---|---|---|---|---|---|---|---|---|---|---|---|---|
| 2010 | 1 | 17 | 15 | 6 | 1 | 0 | 1 | 11 | 4 | 16 | 18 | 11 |
| 2011 | 15 | 11 | 1 | 14 | 1 | 1 | 9 | 10 | 11 | 16 | 10 | 39 |
| 2012 | 18 | 30 | 13 | 21 | 19 | 28 | 32 | 12 | 16 | 1 | 47 | 21 |
| 2013 | 2 | 14 | 22 | 21 | 14 | 52 | 46 | 27 | 7 | 21 | 19 | 39 |
| 2014 | 32 | 39 | 65 | 44 | 45 | 70 | 69 | 32 | 51 | 45 | 74 | 86 |
| 2015 | 21 | 108 | 66 | 55 | 75 | 60 | 51 | 28 | 61 | 89 | 89 | 59 |
| 2016 | 79 | 94 | 114 | 169 | 188 | 152 | 180 | 97 | 104 | 132 | 39 | 97 |
| 2017 | 93 | 227 | 180 | 180 | 147 | 168 | 121 | 205 | 229 | 213 | 200 | 168 |
| 2018 | 138 | 186 | 385 | 181 | 261 | 464 | 201 | 284 | 265 | 377 | 308 | 336 |
| 2019 | 399 | 436 | 647 | 561 | 453 | 438 | 231 | 395 | 387 | 560 | 373 | 480 |
| 2020 | 485 | 515 | 526 | 386 | 434 | 482 | 329 | 349 | 418 | 433 | 567 | 642 |
| 2021 | 608 | 587 | 514 | 506 | 519 | 725 | 459 | 536 | 424 | 485 | 532 | 859 |
| 2022 | 680 | 501 | 344 | 330 | 472 | 393 | 339 | 242 | 606 | 640 | 817 | 380 |
| 2023 | 265 | 363 | 459 | 489 | 456 | 391 | 402 | 370 | 348 | 352 | 370 | 350 |
| 2024 | 317 | |||||||||||
| - = No Data Reported; -- = Not Applicable; NA = Not Available; W = Withheld to avoid disclosure of individual company data. |
| Release Date: 3/29/2024 |
| Next Release Date: 4/30/2024 |