|
Download Data (XLS File) |
|
||||||||
|
||||||||
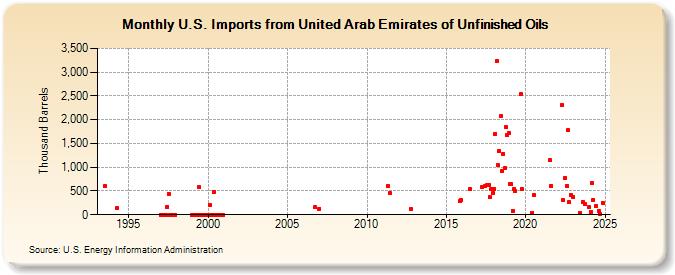
| U.S. Imports from United Arab Emirates of Unfinished Oils (Thousand Barrels) | ||||||||
| Year | Jan | Feb | Mar | Apr | May | Jun | Jul | Aug | Sep | Oct | Nov | Dec |
|---|---|---|---|---|---|---|---|---|---|---|---|---|
| 1993 | 603 | |||||||||||
| 1994 | 131 | |||||||||||
| 1997 | 0 | 0 | 0 | 0 | 0 | 171 | 445 | 0 | 0 | 0 | 0 | 0 |
| 1999 | 0 | 0 | 0 | 0 | 0 | 583 | 0 | 0 | 0 | 0 | 0 | 0 |
| 2000 | 0 | 211 | 0 | 0 | 487 | 0 | 0 | 0 | 0 | 0 | 0 | 0 |
| 2006 | 157 | |||||||||||
| 2007 | 128 | |||||||||||
| 2011 | 594 | 454 | ||||||||||
| 2012 | 123 | |||||||||||
| 2015 | 284 | 309 | ||||||||||
| 2016 | 531 | |||||||||||
| 2017 | 591 | 597 | 635 | 634 | 372 | 547 | 458 | |||||
| 2018 | 550 | 1,699 | 3,233 | 1,036 | 1,344 | 2,071 | 915 | 1,281 | 974 | 1,843 | 1,675 | 1,710 |
| 2019 | 645 | 644 | 88 | 545 | 500 | 2,530 | 543 | |||||
| 2020 | 45 | 417 | ||||||||||
| 2021 | 1,143 | 610 | ||||||||||
| 2022 | 2,312 | 314 | 777 | 612 | 1,778 | 260 | 410 | |||||
| 2023 | 370 | 40 | 264 | 220 | ||||||||
| 2024 | 165 | |||||||||||
| - = No Data Reported; -- = Not Applicable; NA = Not Available; W = Withheld to avoid disclosure of individual company data. |
| Release Date: 3/29/2024 |
| Next Release Date: 4/30/2024 |