|
Download Data (XLS File) |
|
||||||||
|
||||||||
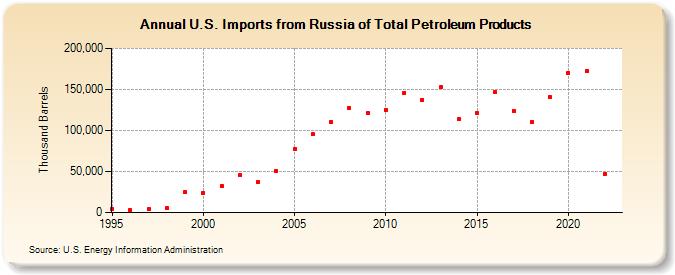
| U.S. Imports from Russia of Total Petroleum Products (Thousand Barrels) | ||||||||
| Decade | Year-0 | Year-1 | Year-2 | Year-3 | Year-4 | Year-5 | Year-6 | Year-7 | Year-8 | Year-9 |
|---|---|---|---|---|---|---|---|---|---|---|
| 1990's | 4,057 | 2,734 | 3,770 | 5,536 | 24,886 | |||||
| 2000's | 23,835 | 32,783 | 45,643 | 37,773 | 51,141 | 77,043 | 95,393 | 110,286 | 127,835 | 121,446 |
| 2010's | 125,248 | 146,262 | 137,578 | 152,637 | 113,671 | 121,257 | 147,314 | 124,239 | 110,305 | 140,812 |
| 2020's | 170,051 | 173,025 | 46,389 |
| - = No Data Reported; -- = Not Applicable; NA = Not Available; W = Withheld to avoid disclosure of individual company data. |
| Release Date: 8/30/2024 |
| Next Release Date: 8/29/2025 |
Referring Pages: