|
Download Data (XLS File) |
|
||||||||
|
||||||||
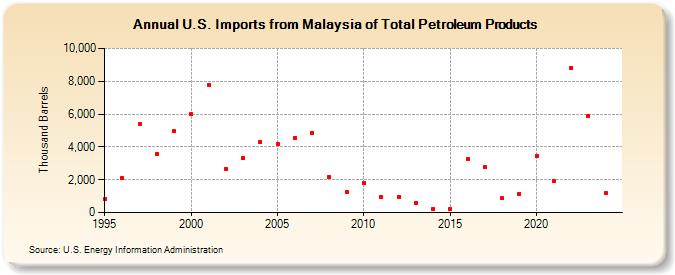
| U.S. Imports from Malaysia of Total Petroleum Products (Thousand Barrels) | ||||||||
| Decade | Year-0 | Year-1 | Year-2 | Year-3 | Year-4 | Year-5 | Year-6 | Year-7 | Year-8 | Year-9 |
|---|---|---|---|---|---|---|---|---|---|---|
| 1990's | 799 | 2,134 | 5,364 | 3,557 | 4,955 | |||||
| 2000's | 5,977 | 7,790 | 2,674 | 3,325 | 4,324 | 4,201 | 4,559 | 4,876 | 2,180 | 1,272 |
| 2010's | 1,823 | 922 | 959 | 570 | 224 | 229 | 3,251 | 2,802 | 865 | 1,156 |
| 2020's | 3,473 | 1,898 | 8,825 | 5,895 | 1,028 |
| - = No Data Reported; -- = Not Applicable; NA = Not Available; W = Withheld to avoid disclosure of individual company data. |
| Release Date: 6/30/2025 |
| Next Release Date: 8/29/2025 |