|
Download Data (XLS File) |
|
||||||||
|
||||||||
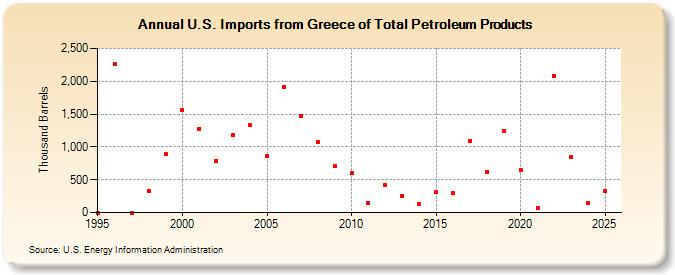
| U.S. Imports from Greece of Total Petroleum Products (Thousand Barrels) | ||||||||
| Decade | Year-0 | Year-1 | Year-2 | Year-3 | Year-4 | Year-5 | Year-6 | Year-7 | Year-8 | Year-9 |
|---|---|---|---|---|---|---|---|---|---|---|
| 1990's | 0 | 2,256 | 0 | 335 | 892 | |||||
| 2000's | 1,556 | 1,278 | 789 | 1,180 | 1,329 | 855 | 1,915 | 1,463 | 1,082 | 705 |
| 2010's | 597 | 140 | 418 | 258 | 132 | 319 | 294 | 1,096 | 624 | 1,242 |
| 2020's | 647 | 70 | 2,078 | 844 |
| - = No Data Reported; -- = Not Applicable; NA = Not Available; W = Withheld to avoid disclosure of individual company data. |
| Release Date: 3/29/2024 |
| Next Release Date: 8/30/2024 |
Referring Pages: