|
Download Data (XLS File) |
|
||||||||
|
||||||||
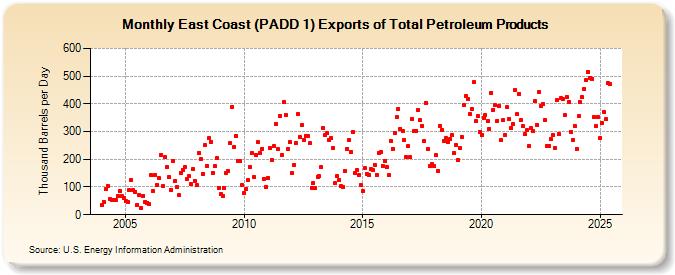
| East Coast (PADD 1) Exports of Total Petroleum Products (Thousand Barrels per Day) | ||||||||
| Year | Jan | Feb | Mar | Apr | May | Jun | Jul | Aug | Sep | Oct | Nov | Dec |
|---|---|---|---|---|---|---|---|---|---|---|---|---|
| 2004 | 35 | 47 | 92 | 104 | 57 | 52 | 52 | 52 | 67 | 85 | 67 | 61 |
| 2005 | 48 | 47 | 89 | 125 | 89 | 83 | 36 | 71 | 24 | 69 | 47 | 44 |
| 2006 | 38 | 143 | 85 | 144 | 107 | 131 | 217 | 103 | 207 | 173 | 135 | 90 |
| 2007 | 194 | 122 | 100 | 70 | 150 | 163 | 172 | 130 | 138 | 111 | 164 | 122 |
| 2008 | 106 | 224 | 200 | 146 | 250 | 177 | 275 | 264 | 152 | 174 | 203 | 97 |
| 2009 | 74 | 68 | 96 | 151 | 157 | 257 | 389 | 245 | 284 | 192 | 193 | 108 |
| 2010 | 77 | 92 | 125 | 173 | 223 | 136 | 217 | 261 | 224 | 238 | 129 | 100 |
| 2011 | 134 | 240 | 198 | 247 | 326 | 236 | 356 | 217 | 407 | 360 | 237 | 262 |
| 2012 | 149 | 180 | 258 | 363 | 281 | 323 | 270 | 284 | 284 | 257 | 98 | 114 |
| 2013 | 95 | 137 | 138 | 172 | 312 | 286 | 293 | 268 | 276 | 242 | 113 | 138 |
| 2014 | 124 | 102 | 101 | 159 | 238 | 269 | 228 | 300 | 151 | 161 | 142 | 107 |
| 2015 | 84 | 167 | 147 | 143 | 165 | 161 | 181 | 145 | 223 | 225 | 176 | 194 |
| 2016 | 172 | 143 | 267 | 238 | 296 | 351 | 381 | 310 | 303 | 268 | 208 | 247 |
| 2017 | 207 | 345 | 302 | 302 | 379 | 340 | 321 | 265 | 404 | 237 | 175 | 182 |
| 2018 | 175 | 214 | 159 | 321 | 307 | 267 | 277 | 264 | 272 | 286 | 224 | 252 |
| 2019 | 198 | 239 | 282 | 395 | 429 | 418 | 364 | 381 | 477 | 337 | 355 | 300 |
| 2020 | 287 | 349 | 359 | 338 | 310 | 440 | 379 | 394 | 339 | 393 | 269 | 341 |
| 2021 | 287 | 387 | 346 | 313 | 326 | 449 | 362 | 437 | 340 | 319 | 290 | 306 |
| 2022 | 248 | 313 | 301 | 409 | 325 | 444 | 393 | 400 | 341 | 247 | 247 | 273 |
| 2023 | 301 | 259 | 392 | 311 | 404 | 400 | 357 | 431 | 415 | 305 | 266 | 329 |
| 2024 | 250 | 354 | 402 | 425 | ||||||||
| - = No Data Reported; -- = Not Applicable; NA = Not Available; W = Withheld to avoid disclosure of individual company data. |
| Release Date: 6/28/2024 |
| Next Release Date: 7/31/2024 |