|
Download Data (XLS File) |
|
||||||||
|
||||||||
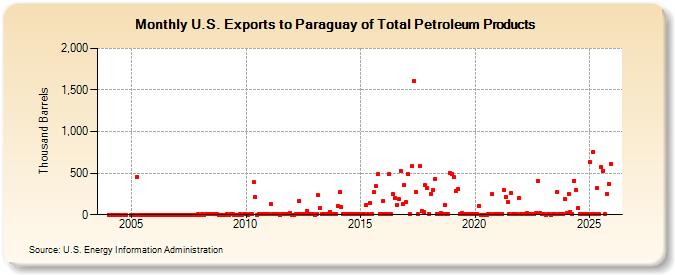
| U.S. Exports to Paraguay of Total Petroleum Products (Thousand Barrels) | ||||||||
| Year | Jan | Feb | Mar | Apr | May | Jun | Jul | Aug | Sep | Oct | Nov | Dec |
|---|---|---|---|---|---|---|---|---|---|---|---|---|
| 2004 | 1 | 0 | 0 | 1 | 0 | 0 | 0 | 0 | 0 | |||
| 2005 | 0 | 0 | 1 | 452 | 1 | 0 | 0 | 0 | 1 | 0 | 0 | 0 |
| 2006 | 1 | 0 | 0 | 1 | 1 | 2 | 1 | 0 | 1 | 0 | 0 | 2 |
| 2007 | 0 | 1 | 0 | 1 | 2 | 0 | 1 | 1 | 1 | 2 | 2 | 4 |
| 2008 | 1 | 3 | 2 | 4 | 5 | 3 | 7 | 3 | 4 | 4 | 1 | 1 |
| 2009 | 1 | 2 | 5 | 1 | 3 | 5 | 2 | 0 | 2 | 3 | 2 | 4 |
| 2010 | 3 | 2 | 4 | 3 | 390 | 211 | 2 | 14 | 3 | 7 | 5 | 3 |
| 2011 | 3 | 124 | 7 | 14 | 9 | 4 | 2 | 5 | 8 | 5 | 4 | 18 |
| 2012 | 2 | 2 | 7 | 6 | 165 | 6 | 10 | 4 | 50 | 3 | 7 | 4 |
| 2013 | 2 | 8 | 232 | 81 | 5 | 9 | 8 | 4 | 37 | 10 | 3 | 5 |
| 2014 | 104 | 268 | 90 | 7 | 4 | 8 | 4 | 5 | 6 | 5 | 6 | 7 |
| 2015 | 8 | 7 | 5 | 115 | 5 | 146 | 4 | 270 | 340 | 484 | 6 | 6 |
| 2016 | 168 | 9 | 6 | 488 | 8 | 249 | 206 | 121 | 191 | 529 | 126 | 357 |
| 2017 | 148 | 486 | 8 | 580 | 1,610 | 279 | 4 | 581 | 42 | 37 | 353 | 318 |
| 2018 | 9 | 250 | 300 | 434 | 6 | 8 | 15 | 7 | 116 | 5 | 4 | 497 |
| 2019 | 484 | 448 | 284 | 304 | 7 | 16 | 5 | 6 | 4 | 6 | 5 | 6 |
| 2020 | 4 | 4 | 108 | 1 | 0 | 1 | 1 | 3 | 5 | 245 | 3 | 7 |
| 2021 | 4 | 4 | 9 | 301 | 209 | 147 | 6 | 263 | 4 | 7 | 5 | 205 |
| 2022 | 4 | 4 | 3 | 19 | 7 | 5 | 4 | 5 | 25 | 408 | 23 | 3 |
| 2023 | 3 | 2 | 3 | 4 | 2 | 5 | 3 | 274 | 7 | 4 | 5 | 183 |
| 2024 | 19 | 249 | 6 | 3 | ||||||||
| - = No Data Reported; -- = Not Applicable; NA = Not Available; W = Withheld to avoid disclosure of individual company data. |
| Release Date: 6/28/2024 |
| Next Release Date: 7/31/2024 |