|
Download Data (XLS File) |
|
||||||||
|
||||||||
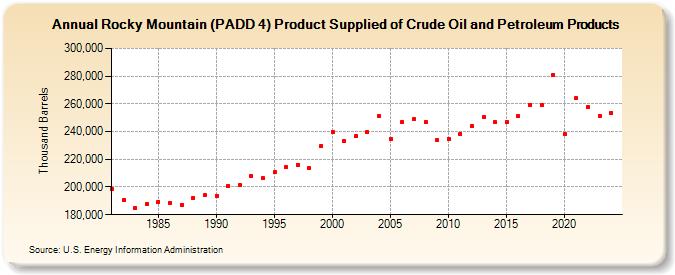
| Rocky Mountain (PADD 4) Product Supplied of Crude Oil and Petroleum Products (Thousand Barrels) | ||||||||
| Decade | Year-0 | Year-1 | Year-2 | Year-3 | Year-4 | Year-5 | Year-6 | Year-7 | Year-8 | Year-9 |
|---|---|---|---|---|---|---|---|---|---|---|
| 1980's | 198,394 | 190,793 | 185,148 | 187,583 | 189,403 | 188,636 | 187,201 | 192,289 | 193,913 | |
| 1990's | 193,821 | 200,632 | 201,090 | 207,917 | 206,163 | 210,474 | 214,207 | 216,219 | 213,404 | 229,418 |
| 2000's | 239,743 | 233,307 | 236,533 | 239,502 | 251,235 | 234,709 | 246,789 | 248,798 | 246,985 | 233,573 |
| 2010's | 234,868 | 238,350 | 243,988 | 250,586 | 246,755 | 246,724 | 250,962 | 259,226 | 258,906 | 280,863 |
| 2020's | 238,057 | 263,919 | 257,836 | 251,505 |
| - = No Data Reported; -- = Not Applicable; NA = Not Available; W = Withheld to avoid disclosure of individual company data. |
| Release Date: 8/30/2024 |
| Next Release Date: 8/29/2025 |