|
Download Data (XLS File) |
|
||||||||
|
||||||||
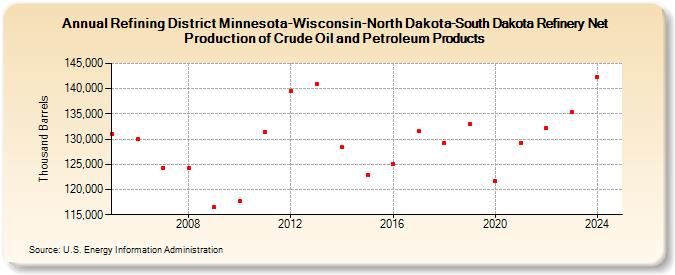
| Refining District Minnesota-Wisconsin-North Dakota-South Dakota Refinery Net Production of Crude Oil and Petroleum Products (Thousand Barrels) | ||||||||
| Decade | Year-0 | Year-1 | Year-2 | Year-3 | Year-4 | Year-5 | Year-6 | Year-7 | Year-8 | Year-9 |
|---|---|---|---|---|---|---|---|---|---|---|
| 2000's | 130,953 | 129,970 | 124,350 | 124,178 | 116,462 | |||||
| 2010's | 117,691 | 131,416 | 139,550 | 140,878 | 128,374 | 122,895 | 125,037 | 131,575 | 129,129 | 133,009 |
| 2020's | 121,605 | 129,215 | 132,178 | 135,303 |
| - = No Data Reported; -- = Not Applicable; NA = Not Available; W = Withheld to avoid disclosure of individual company data. |
| Release Date: 8/30/2024 |
| Next Release Date: 8/29/2025 |