|
Download Data (XLS File) |
|
||||||||
|
||||||||
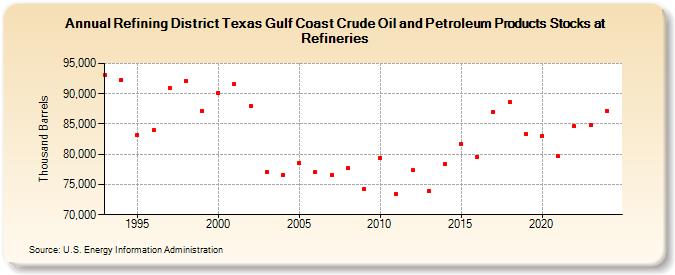
| Refining District Texas Gulf Coast Crude Oil and Petroleum Products Stocks at Refineries (Thousand Barrels) | ||||||||
| Decade | Year-0 | Year-1 | Year-2 | Year-3 | Year-4 | Year-5 | Year-6 | Year-7 | Year-8 | Year-9 |
|---|---|---|---|---|---|---|---|---|---|---|
| 1990's | 93,043 | 92,312 | 83,216 | 84,011 | 91,001 | 92,172 | 87,207 | |||
| 2000's | 90,199 | 91,531 | 87,979 | 77,136 | 76,591 | 78,614 | 77,106 | 76,587 | 77,680 | 74,311 |
| 2010's | 79,388 | 73,447 | 77,336 | 73,860 | 78,389 | 81,685 | 79,600 | 87,022 | 88,613 | 83,424 |
| 2020's | 83,015 | 79,641 | 84,645 | 84,785 |
| - = No Data Reported; -- = Not Applicable; NA = Not Available; W = Withheld to avoid disclosure of individual company data. |
| Release Date: 8/30/2024 |
| Next Release Date: 8/29/2025 |