|
Download Data (XLS File) |
|
||||||||
|
||||||||
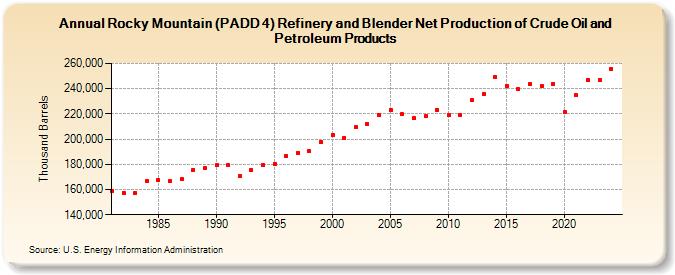
| Rocky Mountain (PADD 4) Refinery and Blender Net Production of Crude Oil and Petroleum Products (Thousand Barrels) | ||||||||
| Decade | Year-0 | Year-1 | Year-2 | Year-3 | Year-4 | Year-5 | Year-6 | Year-7 | Year-8 | Year-9 |
|---|---|---|---|---|---|---|---|---|---|---|
| 1980's | 158,559 | 157,428 | 157,160 | 166,703 | 167,279 | 166,482 | 167,980 | 175,564 | 176,856 | |
| 1990's | 179,080 | 179,233 | 170,485 | 175,439 | 179,458 | 180,321 | 186,440 | 189,307 | 190,171 | 197,578 |
| 2000's | 203,570 | 201,026 | 209,203 | 212,221 | 218,870 | 222,924 | 219,519 | 216,479 | 217,939 | 222,977 |
| 2010's | 219,047 | 219,369 | 230,918 | 235,776 | 249,085 | 241,891 | 239,520 | 243,584 | 242,344 | 243,850 |
| 2020's | 221,403 | 234,768 | 246,927 | 246,665 |
| - = No Data Reported; -- = Not Applicable; NA = Not Available; W = Withheld to avoid disclosure of individual company data. |
| Release Date: 3/29/2024 |
| Next Release Date: 8/30/2024 |