|
Download Data (XLS File) |
|
||||||||
|
||||||||
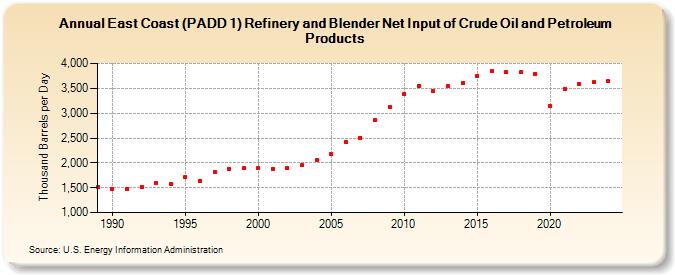
| East Coast (PADD 1) Refinery and Blender Net Input of Crude Oil and Petroleum Products (Thousand Barrels per Day) | ||||||||
| Decade | Year-0 | Year-1 | Year-2 | Year-3 | Year-4 | Year-5 | Year-6 | Year-7 | Year-8 | Year-9 |
|---|---|---|---|---|---|---|---|---|---|---|
| 1980's | 1,507 | |||||||||
| 1990's | 1,482 | 1,481 | 1,513 | 1,602 | 1,580 | 1,718 | 1,638 | 1,820 | 1,875 | 1,889 |
| 2000's | 1,896 | 1,877 | 1,898 | 1,951 | 2,048 | 2,173 | 2,421 | 2,507 | 2,867 | 3,133 |
| 2010's | 3,378 | 3,549 | 3,444 | 3,538 | 3,607 | 3,748 | 3,848 | 3,822 | 3,821 | 3,792 |
| 2020's | 3,153 | 3,479 | 3,592 | 3,618 |
| - = No Data Reported; -- = Not Applicable; NA = Not Available; W = Withheld to avoid disclosure of individual company data. |
| Release Date: 6/28/2024 |
| Next Release Date: 8/30/2024 |