|
Download Data (XLS File) |
|
||||||||
|
||||||||
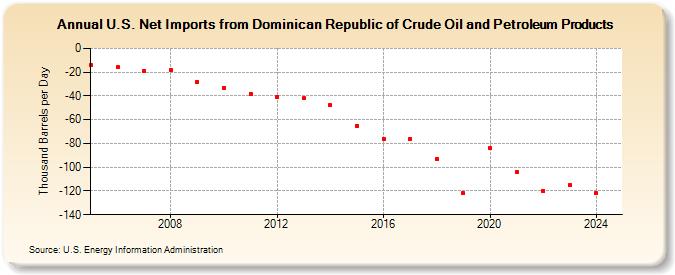
| U.S. Net Imports from Dominican Republic of Crude Oil and Petroleum Products (Thousand Barrels per Day) | ||||||||
| Decade | Year-0 | Year-1 | Year-2 | Year-3 | Year-4 | Year-5 | Year-6 | Year-7 | Year-8 | Year-9 |
|---|---|---|---|---|---|---|---|---|---|---|
| 2000's | -14 | -16 | -19 | -18 | -28 | |||||
| 2010's | -33 | -38 | -41 | -42 | -48 | -65 | -76 | -76 | -93 | -122 |
| 2020's | -84 | -104 | -120 | -115 | -122 |
| - = No Data Reported; -- = Not Applicable; NA = Not Available; W = Withheld to avoid disclosure of individual company data. |
| Release Date: 6/30/2025 |
| Next Release Date: 8/29/2025 |