|
Download Data (XLS File) |
|
||||||||
|
||||||||
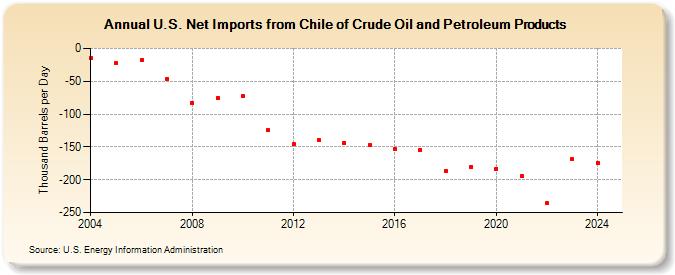
| U.S. Net Imports from Chile of Crude Oil and Petroleum Products (Thousand Barrels per Day) | ||||||||
| Decade | Year-0 | Year-1 | Year-2 | Year-3 | Year-4 | Year-5 | Year-6 | Year-7 | Year-8 | Year-9 |
|---|---|---|---|---|---|---|---|---|---|---|
| 2000's | -15 | -23 | -17 | -46 | -83 | -75 | ||||
| 2010's | -73 | -125 | -146 | -140 | -144 | -147 | -153 | -154 | -186 | -180 |
| 2020's | -183 | -194 | -236 | -169 |
| - = No Data Reported; -- = Not Applicable; NA = Not Available; W = Withheld to avoid disclosure of individual company data. |
| Release Date: 6/28/2024 |
| Next Release Date: 8/30/2024 |