|
Download Data (XLS File) |
|
||||||||
|
||||||||
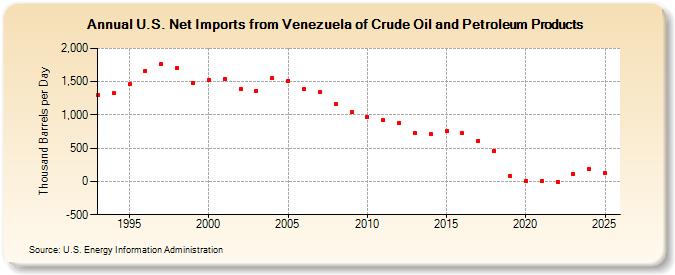
| U.S. Net Imports from Venezuela of Crude Oil and Petroleum Products (Thousand Barrels per Day) | ||||||||
| Decade | Year-0 | Year-1 | Year-2 | Year-3 | Year-4 | Year-5 | Year-6 | Year-7 | Year-8 | Year-9 |
|---|---|---|---|---|---|---|---|---|---|---|
| 1990's | 1,296 | 1,322 | 1,468 | 1,667 | 1,758 | 1,700 | 1,480 | |||
| 2000's | 1,530 | 1,540 | 1,387 | 1,364 | 1,548 | 1,515 | 1,392 | 1,339 | 1,162 | 1,037 |
| 2010's | 968 | 919 | 875 | 725 | 713 | 754 | 721 | 610 | 462 | 83 |
| 2020's | 0 | 0 | -2 | 118 |
| - = No Data Reported; -- = Not Applicable; NA = Not Available; W = Withheld to avoid disclosure of individual company data. |
| Release Date: 6/28/2024 |
| Next Release Date: 8/30/2024 |