|
Download Data (XLS File) |
|
||||||||
|
||||||||
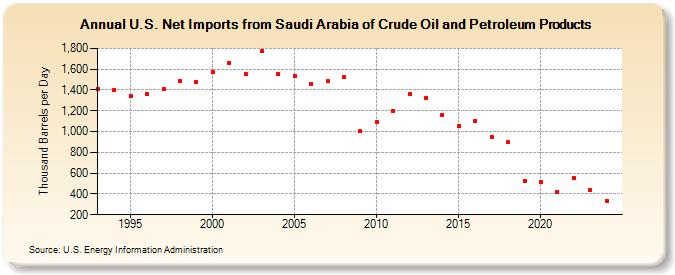
| U.S. Net Imports from Saudi Arabia of Crude Oil and Petroleum Products (Thousand Barrels per Day) | ||||||||
| Decade | Year-0 | Year-1 | Year-2 | Year-3 | Year-4 | Year-5 | Year-6 | Year-7 | Year-8 | Year-9 |
|---|---|---|---|---|---|---|---|---|---|---|
| 1990's | 1,413 | 1,402 | 1,343 | 1,362 | 1,407 | 1,491 | 1,478 | |||
| 2000's | 1,571 | 1,662 | 1,551 | 1,774 | 1,557 | 1,536 | 1,462 | 1,483 | 1,529 | 1,003 |
| 2010's | 1,096 | 1,193 | 1,364 | 1,326 | 1,163 | 1,056 | 1,102 | 952 | 897 | 528 |
| 2020's | 514 | 421 | 554 | 436 |
| - = No Data Reported; -- = Not Applicable; NA = Not Available; W = Withheld to avoid disclosure of individual company data. |
| Release Date: 8/30/2024 |
| Next Release Date: 8/29/2025 |