|
Download Data (XLS File) |
|
||||||||
|
||||||||
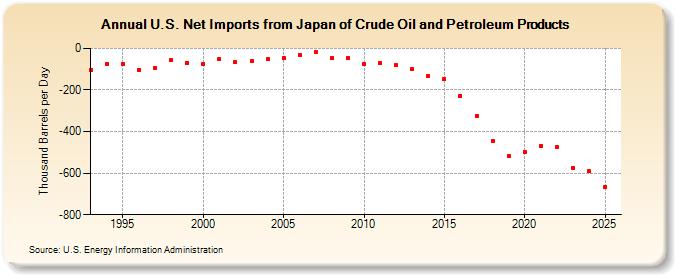
| U.S. Net Imports from Japan of Crude Oil and Petroleum Products (Thousand Barrels per Day) | ||||||||
| Decade | Year-0 | Year-1 | Year-2 | Year-3 | Year-4 | Year-5 | Year-6 | Year-7 | Year-8 | Year-9 |
|---|---|---|---|---|---|---|---|---|---|---|
| 1990's | -105 | -73 | -76 | -102 | -94 | -57 | -71 | |||
| 2000's | -75 | -50 | -67 | -62 | -52 | -45 | -31 | -19 | -44 | -47 |
| 2010's | -75 | -70 | -80 | -100 | -135 | -148 | -229 | -323 | -445 | -518 |
| 2020's | -497 | -468 | -473 | -606 |
| - = No Data Reported; -- = Not Applicable; NA = Not Available; W = Withheld to avoid disclosure of individual company data. |
| Release Date: 6/28/2024 |
| Next Release Date: 8/30/2024 |