|
Download Data (XLS File) |
|
||||||||
|
||||||||
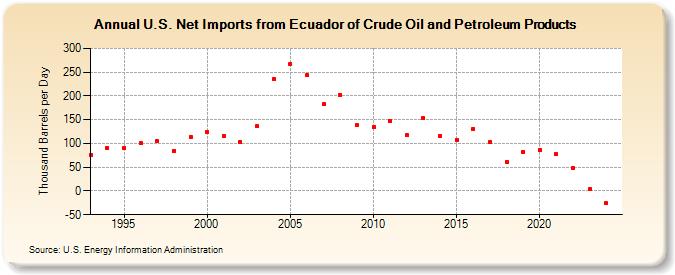
| U.S. Net Imports from Ecuador of Crude Oil and Petroleum Products (Thousand Barrels per Day) | ||||||||
| Decade | Year-0 | Year-1 | Year-2 | Year-3 | Year-4 | Year-5 | Year-6 | Year-7 | Year-8 | Year-9 |
|---|---|---|---|---|---|---|---|---|---|---|
| 1990's | 76 | 90 | 90 | 100 | 105 | 85 | 114 | |||
| 2000's | 124 | 116 | 102 | 136 | 236 | 268 | 244 | 182 | 202 | 138 |
| 2010's | 135 | 147 | 117 | 153 | 116 | 108 | 131 | 104 | 61 | 82 |
| 2020's | 87 | 77 | 48 | 5 |
| - = No Data Reported; -- = Not Applicable; NA = Not Available; W = Withheld to avoid disclosure of individual company data. |
| Release Date: 6/28/2024 |
| Next Release Date: 8/30/2024 |