|
Download Data (XLS File) |
|
||||||||
|
||||||||
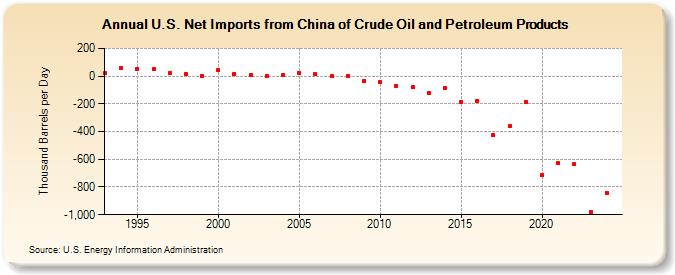
| U.S. Net Imports from China of Crude Oil and Petroleum Products (Thousand Barrels per Day) | ||||||||
| Decade | Year-0 | Year-1 | Year-2 | Year-3 | Year-4 | Year-5 | Year-6 | Year-7 | Year-8 | Year-9 |
|---|---|---|---|---|---|---|---|---|---|---|
| 1990's | 22 | 58 | 52 | 49 | 23 | 16 | 2 | |||
| 2000's | 41 | 18 | 11 | 3 | 9 | 21 | 17 | 0 | 3 | -33 |
| 2010's | -43 | -69 | -81 | -122 | -84 | -185 | -181 | -426 | -357 | -186 |
| 2020's | -712 | -628 | -635 | -966 |
| - = No Data Reported; -- = Not Applicable; NA = Not Available; W = Withheld to avoid disclosure of individual company data. |
| Release Date: 3/29/2024 |
| Next Release Date: 8/30/2024 |