|
Download Data (XLS File) |
|
||||||||
|
||||||||
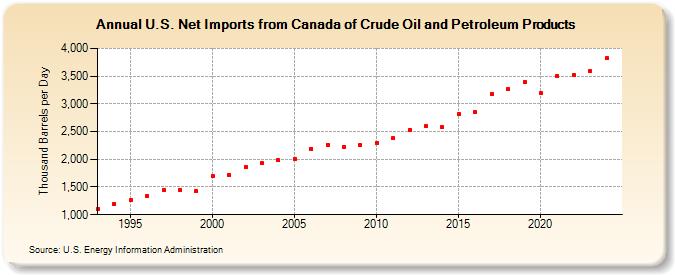
| U.S. Net Imports from Canada of Crude Oil and Petroleum Products (Thousand Barrels per Day) | ||||||||
| Decade | Year-0 | Year-1 | Year-2 | Year-3 | Year-4 | Year-5 | Year-6 | Year-7 | Year-8 | Year-9 |
|---|---|---|---|---|---|---|---|---|---|---|
| 1990's | 1,109 | 1,194 | 1,260 | 1,330 | 1,444 | 1,451 | 1,421 | |||
| 2000's | 1,697 | 1,717 | 1,864 | 1,932 | 1,980 | 2,001 | 2,194 | 2,266 | 2,229 | 2,257 |
| 2010's | 2,302 | 2,377 | 2,530 | 2,593 | 2,578 | 2,810 | 2,845 | 3,183 | 3,268 | 3,396 |
| 2020's | 3,193 | 3,506 | 3,520 | 3,624 |
| - = No Data Reported; -- = Not Applicable; NA = Not Available; W = Withheld to avoid disclosure of individual company data. |
| Release Date: 6/28/2024 |
| Next Release Date: 8/30/2024 |