|
Download Data (XLS File) |
|
||||||||
|
||||||||
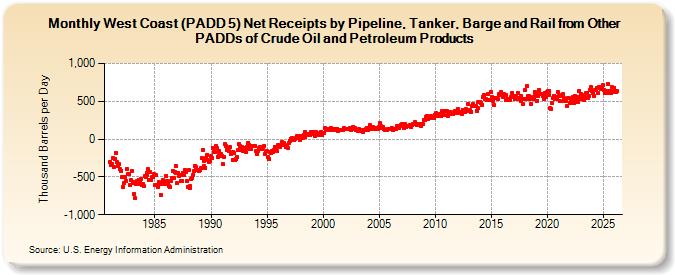
| West Coast (PADD 5) Net Receipts by Pipeline, Tanker, Barge and Rail from Other PADDs of Crude Oil and Petroleum Products (Thousand Barrels per Day) | ||||||||
| Year | Jan | Feb | Mar | Apr | May | Jun | Jul | Aug | Sep | Oct | Nov | Dec |
|---|---|---|---|---|---|---|---|---|---|---|---|---|
| 1981 | -299 | -341 | -335 | -251 | -368 | -265 | -179 | -306 | -356 | -339 | -333 | -402 |
| 1982 | -417 | -503 | -632 | -583 | -498 | -550 | -394 | -461 | -467 | -606 | -540 | -419 |
| 1983 | -568 | -585 | -723 | -783 | -597 | -555 | -595 | -535 | -568 | -526 | -604 | -592 |
| 1984 | -620 | -487 | -503 | -446 | -480 | -400 | -546 | -441 | -543 | -506 | -495 | -459 |
| 1985 | -607 | -480 | -606 | -627 | -565 | -597 | -735 | -596 | -575 | -541 | -569 | -593 |
| 1986 | -483 | -553 | -600 | -622 | -633 | -554 | -513 | -418 | -512 | -431 | -350 | -453 |
| 1987 | -584 | -443 | -490 | -479 | -558 | -555 | -442 | -469 | -410 | -438 | -554 | -627 |
| 1988 | -411 | -652 | -623 | -522 | -518 | -474 | -425 | -352 | -374 | -403 | -406 | -425 |
| 1989 | -405 | -386 | -254 | -143 | -358 | -286 | -380 | -250 | -207 | -283 | -300 | -290 |
| 1990 | -229 | -253 | -113 | -165 | -171 | -86 | -116 | -231 | -162 | -211 | -224 | -194 |
| 1991 | -218 | -334 | -232 | -71 | -92 | -138 | -130 | -153 | -111 | -202 | -185 | -275 |
| 1992 | -168 | -188 | -275 | -267 | -238 | -149 | -65 | -88 | -145 | -110 | -157 | -126 |
| 1993 | -122 | -171 | -119 | -99 | -45 | -77 | -136 | -131 | -93 | -94 | -86 | -87 |
| 1994 | -161 | -195 | -161 | -118 | -110 | -113 | -126 | -129 | -98 | -88 | -191 | -162 |
| 1995 | -164 | -243 | -260 | -173 | -182 | -159 | -174 | -140 | -100 | -121 | -117 | -161 |
| 1996 | -83 | -80 | -104 | -73 | -40 | -82 | -46 | -75 | -98 | -97 | -114 | -56 |
| 1997 | -19 | 1 | -5 | 13 | 3 | -16 | -1 | 12 | 36 | 42 | 21 | -18 |
| 1998 | 36 | 14 | 8 | 58 | 93 | 30 | 68 | 71 | 69 | 55 | 54 | 100 |
| 1999 | 68 | 89 | 70 | 40 | 96 | 68 | 63 | 63 | 49 | 80 | 94 | 59 |
| 2000 | 86 | 85 | 150 | 117 | 125 | 130 | 117 | 137 | 146 | 138 | 126 | 129 |
| 2001 | 123 | 135 | 120 | 137 | 113 | 125 | 124 | 126 | 125 | 125 | 145 | 130 |
| 2002 | 139 | 140 | 140 | 136 | 129 | 153 | 119 | 132 | 165 | 137 | 141 | 125 |
| 2003 | 121 | 112 | 128 | 103 | 107 | 122 | 105 | 100 | 117 | 114 | 127 | 143 |
| 2004 | 126 | 152 | 180 | 138 | 150 | 164 | 141 | 130 | 135 | 145 | 144 | 137 |
| 2005 | 164 | 209 | 178 | 142 | 155 | 139 | 117 | 120 | 124 | 127 | 129 | 131 |
| 2006 | 130 | 149 | 128 | 125 | 133 | 140 | 140 | 167 | 158 | 144 | 171 | 190 |
| 2007 | 197 | 202 | 145 | 194 | 178 | 162 | 170 | 176 | 176 | 181 | 155 | 187 |
| 2008 | 204 | 203 | 222 | 201 | 189 | 200 | 196 | 183 | 196 | 179 | 201 | 195 |
| 2009 | 256 | 253 | 296 | 310 | 269 | 296 | 275 | 304 | 291 | 290 | 277 | 323 |
| 2010 | 324 | 345 | 335 | 312 | 318 | 338 | 308 | 368 | 322 | 323 | 371 | 368 |
| 2011 | 365 | 303 | 319 | 336 | 358 | 347 | 336 | 333 | 354 | 365 | 368 | 344 |
| 2012 | 395 | 356 | 339 | 352 | 331 | 387 | 355 | 386 | 358 | 393 | 369 | 466 |
| 2013 | 366 | 383 | 362 | 436 | 458 | 434 | 439 | 444 | 375 | 411 | 485 | 487 |
| 2014 | 495 | 483 | 453 | 561 | 580 | 532 | 533 | 512 | 592 | 523 | 518 | 625 |
| 2015 | 558 | 502 | 540 | 450 | 540 | 548 | 538 | 532 | 593 | 577 | 622 | 600 |
| 2016 | 559 | 595 | 585 | 522 | 579 | 535 | 533 | 513 | 511 | 558 | 607 | 565 |
| 2017 | 568 | 533 | 571 | 541 | 611 | 532 | 542 | 506 | 568 | 524 | 458 | 536 |
| 2018 | 655 | 528 | 703 | 565 | 568 | 528 | 467 | 543 | 553 | 535 | 625 | 566 |
| 2019 | 611 | 510 | 565 | 646 | 600 | 601 | 599 | 565 | 530 | 609 | 557 | 619 |
| 2020 | 630 | 588 | 641 | 407 | 403 | 477 | 537 | 571 | 535 | 551 | 529 | 621 |
| 2021 | 575 | 499 | 573 | 577 | 590 | 546 | 507 | 504 | 501 | 443 | 548 | 539 |
| 2022 | 477 | 522 | 517 | 563 | 474 | 575 | 521 | 542 | 488 | 557 | 640 | 536 |
| 2023 | 590 | 583 | 532 | 523 | 552 | 608 | 608 | 543 | 546 | 685 | 682 | 640 |
| 2024 | 596 | |||||||||||
| - = No Data Reported; -- = Not Applicable; NA = Not Available; W = Withheld to avoid disclosure of individual company data. |
| Release Date: 3/29/2024 |
| Next Release Date: 4/30/2024 |