|
Download Data (XLS File) |
|
||||||||
|
||||||||
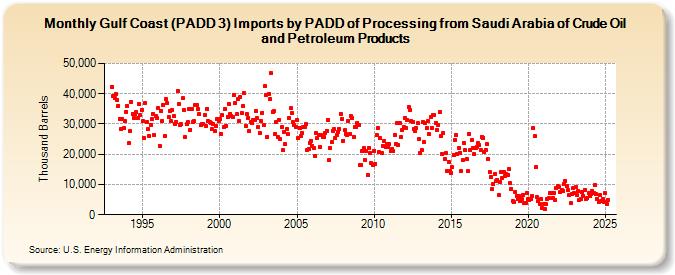
| Gulf Coast (PADD 3) Imports by PADD of Processing from Saudi Arabia of Crude Oil and Petroleum Products (Thousand Barrels) | ||||||||
| Year | Jan | Feb | Mar | Apr | May | Jun | Jul | Aug | Sep | Oct | Nov | Dec |
|---|---|---|---|---|---|---|---|---|---|---|---|---|
| 1993 | 42,318 | 39,251 | 38,528 | 39,846 | 37,851 | 36,099 | 31,668 | 28,220 | 31,790 | 28,538 | 31,034 | 34,056 |
| 1994 | 35,933 | 23,571 | 27,622 | 37,356 | 33,346 | 32,035 | 33,330 | 33,960 | 31,869 | 36,569 | 32,842 | 34,756 |
| 1995 | 30,969 | 25,209 | 36,954 | 30,589 | 28,189 | 26,140 | 29,788 | 31,585 | 33,392 | 26,430 | 32,681 | 32,044 |
| 1996 | 35,271 | 22,828 | 34,451 | 30,935 | 36,346 | 25,935 | 38,176 | 36,930 | 32,384 | 34,336 | 30,859 | 34,677 |
| 1997 | 32,569 | 30,053 | 30,816 | 40,863 | 36,649 | 29,503 | 29,838 | 38,457 | 34,690 | 25,772 | 29,850 | 30,600 |
| 1998 | 34,958 | 28,114 | 35,022 | 30,608 | 30,847 | 36,272 | 36,160 | 34,883 | 33,182 | 29,589 | 30,028 | 30,052 |
| 1999 | 32,886 | 29,457 | 35,110 | 30,880 | 30,713 | 30,236 | 28,242 | 29,991 | 27,565 | 29,407 | 31,653 | 31,009 |
| 2000 | 31,694 | 26,820 | 32,807 | 28,960 | 34,861 | 29,413 | 32,363 | 36,701 | 33,422 | 32,676 | 32,241 | 39,687 |
| 2001 | 36,891 | 33,284 | 38,207 | 31,002 | 38,954 | 33,578 | 36,096 | 40,309 | 29,323 | 33,189 | 32,009 | 27,578 |
| 2002 | 30,623 | 30,461 | 31,210 | 31,331 | 34,197 | 31,844 | 28,997 | 27,180 | 31,062 | 33,732 | 29,532 | 42,415 |
| 2003 | 39,472 | 25,794 | 40,067 | 38,257 | 46,696 | 34,089 | 34,192 | 26,832 | 30,636 | 25,673 | 31,333 | 24,972 |
| 2004 | 28,918 | 21,295 | 27,444 | 23,239 | 28,343 | 26,558 | 31,924 | 35,179 | 33,598 | 30,686 | 29,766 | 28,944 |
| 2005 | 31,375 | 25,269 | 28,802 | 25,929 | 27,145 | 29,146 | 29,060 | 29,838 | 21,396 | 21,751 | 23,857 | 24,507 |
| 2006 | 22,824 | 21,928 | 19,320 | 26,864 | 25,484 | 26,414 | 22,365 | 26,194 | 25,760 | 25,718 | 27,015 | 27,816 |
| 2007 | 31,399 | 18,027 | 22,102 | 23,902 | 27,792 | 28,316 | 25,405 | 26,277 | 27,384 | 28,340 | 33,423 | 31,802 |
| 2008 | 24,528 | 27,844 | 26,803 | 26,458 | 31,097 | 26,650 | 32,573 | 31,950 | 25,809 | 28,884 | 29,136 | 30,394 |
| 2009 | 29,525 | 16,331 | 16,489 | 20,996 | 22,107 | 18,087 | 21,153 | 13,059 | 22,218 | 20,411 | 16,982 | 16,281 |
| 2010 | 21,141 | 16,769 | 26,324 | 28,723 | 20,729 | 25,258 | 20,426 | 22,822 | 24,335 | 22,249 | 23,301 | 22,445 |
| 2011 | 23,232 | 21,091 | 21,880 | 20,911 | 26,280 | 23,352 | 30,394 | 23,047 | 30,165 | 25,722 | 28,029 | 29,101 |
| 2012 | 32,006 | 28,721 | 31,364 | 35,490 | 34,764 | 30,871 | 30,814 | 28,411 | 27,825 | 28,639 | 30,222 | 25,145 |
| 2013 | 20,559 | 21,297 | 30,723 | 23,951 | 30,229 | 28,749 | 30,857 | 26,713 | 32,301 | 28,800 | 33,095 | 32,936 |
| 2014 | 30,351 | 28,043 | 29,752 | 33,925 | 25,950 | 20,162 | 26,941 | 18,361 | 20,299 | 14,431 | 17,565 | 14,330 |
| 2015 | 13,781 | 15,665 | 19,760 | 24,785 | 26,202 | 19,911 | 22,008 | 20,495 | 14,444 | 18,065 | 23,829 | 21,422 |
| 2016 | 18,568 | 14,357 | 26,810 | 21,245 | 24,541 | 22,136 | 19,927 | 22,045 | 22,539 | 23,545 | 22,980 | 21,379 |
| 2017 | 25,809 | 25,379 | 20,777 | 21,409 | 23,237 | 18,493 | 14,148 | 12,532 | 8,348 | 10,221 | 13,622 | 11,033 |
| 2018 | 11,515 | 6,551 | 10,834 | 14,130 | 12,192 | 14,259 | 12,638 | 13,496 | 13,148 | 15,016 | 10,372 | 8,432 |
| 2019 | 4,492 | 4,151 | 7,440 | 6,196 | 5,046 | 6,026 | 4,369 | 5,109 | 6,679 | 3,875 | 3,763 | 7,226 |
| 2020 | 5,060 | 4,759 | 5,109 | 6,234 | 28,601 | 25,863 | 15,651 | 5,735 | 4,675 | 3,651 | 5,160 | 2,098 |
| 2021 | 3,639 | 1,982 | 3,436 | 5,170 | 5,411 | 7,329 | 7,014 | 5,441 | 7,142 | 4,945 | 8,989 | 9,463 |
| 2022 | 9,172 | 7,555 | 8,278 | 7,716 | 10,072 | 11,044 | 9,655 | 8,085 | 6,430 | 3,786 | 6,767 | 8,690 |
| 2023 | 7,123 | 9,012 | 6,398 | 7,771 | 4,750 | 5,258 | 7,456 | 6,208 | 8,251 | 5,334 | 5,521 | 7,052 |
| 2024 | 6,139 | 6,964 | 7,937 | 7,255 | ||||||||
| - = No Data Reported; -- = Not Applicable; NA = Not Available; W = Withheld to avoid disclosure of individual company data. |
| Release Date: 6/28/2024 |
| Next Release Date: 7/31/2024 |