|
Download Data (XLS File) |
|
||||||||
|
||||||||
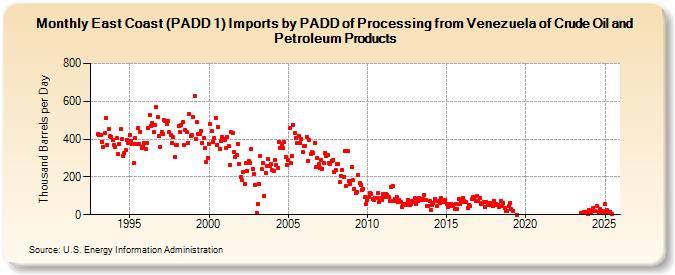
| East Coast (PADD 1) Imports by PADD of Processing from Venezuela of Crude Oil and Petroleum Products (Thousand Barrels per Day) | ||||||||
| Year | Jan | Feb | Mar | Apr | May | Jun | Jul | Aug | Sep | Oct | Nov | Dec |
|---|---|---|---|---|---|---|---|---|---|---|---|---|
| 1993 | 428 | 420 | 424 | 386 | 360 | 430 | 512 | 367 | 452 | 418 | 413 | 395 |
| 1994 | 370 | 359 | 406 | 323 | 375 | 451 | 399 | 309 | 324 | 342 | 397 | 379 |
| 1995 | 424 | 391 | 374 | 274 | 404 | 375 | 457 | 373 | 440 | 352 | 359 | 381 |
| 1996 | 349 | 381 | 458 | 528 | 469 | 484 | 436 | 477 | 569 | 516 | 414 | 360 |
| 1997 | 440 | 425 | 499 | 497 | 482 | 497 | 438 | 423 | 382 | 410 | 303 | 371 |
| 1998 | 369 | 467 | 437 | 472 | 490 | 369 | 448 | 435 | 382 | 535 | 416 | 423 |
| 1999 | 515 | 628 | 400 | 489 | 428 | 426 | 443 | 382 | 407 | 351 | 279 | 300 |
| 2000 | 375 | 478 | 443 | 386 | 407 | 509 | 371 | 464 | 349 | 390 | 411 | 400 |
| 2001 | 397 | 352 | 412 | 365 | 263 | 435 | 432 | 331 | 305 | 317 | 375 | 270 |
| 2002 | 198 | 181 | 227 | 165 | 271 | 233 | 282 | 275 | 349 | 244 | 216 | 156 |
| 2003 | 9 | 56 | 162 | 313 | 240 | 272 | 100 | 219 | 259 | 296 | 260 | 268 |
| 2004 | 235 | 231 | 288 | 262 | 249 | 386 | 354 | 372 | 352 | 383 | 306 | 262 |
| 2005 | 287 | 457 | 272 | 309 | 477 | 431 | 407 | 382 | 417 | 380 | 399 | 331 |
| 2006 | 365 | 365 | 410 | 284 | 397 | 320 | 330 | 325 | 381 | 251 | 299 | 266 |
| 2007 | 248 | 290 | 244 | 273 | 328 | 309 | 315 | 273 | 270 | 285 | 290 | 224 |
| 2008 | 234 | 266 | 268 | 171 | 206 | 236 | 198 | 336 | 151 | 337 | 180 | 165 |
| 2009 | 252 | 182 | 138 | 115 | 120 | 211 | 166 | 156 | 133 | 138 | 92 | 59 |
| 2010 | 80 | 93 | 114 | 112 | 84 | 79 | 87 | 91 | 116 | 65 | 88 | 77 |
| 2011 | 109 | 96 | 110 | 103 | 93 | 73 | 145 | 153 | 74 | 83 | 93 | 68 |
| 2012 | 78 | 65 | 40 | 58 | 57 | 49 | 59 | 80 | 53 | 56 | 70 | 65 |
| 2013 | 87 | 58 | 75 | 89 | 83 | 80 | 81 | 103 | 76 | 47 | 48 | 73 |
| 2014 | 25 | 50 | 64 | 81 | 71 | 46 | 74 | 61 | 89 | 74 | 67 | 77 |
| 2015 | 58 | 39 | 59 | 55 | 45 | 50 | 30 | 59 | 30 | 82 | 55 | 67 |
| 2016 | 86 | 73 | 68 | 67 | 37 | 53 | 44 | 84 | 95 | 81 | 75 | 101 |
| 2017 | 71 | 86 | 56 | 61 | 67 | 40 | 65 | 51 | 53 | 62 | 53 | 44 |
| 2018 | 73 | 56 | 52 | 52 | 43 | 72 | 45 | 62 | 36 | 19 | 22 | 47 |
| 2019 | 63 | 29 | 22 | 0 | ||||||||
| 2023 | 10 | 11 | 17 | 17 | 3 | |||||||
| 2024 | 23 | 17 | 19 | 37 | ||||||||
| - = No Data Reported; -- = Not Applicable; NA = Not Available; W = Withheld to avoid disclosure of individual company data. |
| Release Date: 6/28/2024 |
| Next Release Date: 7/31/2024 |