|
Download Data (XLS File) |
|
||||||||
|
||||||||
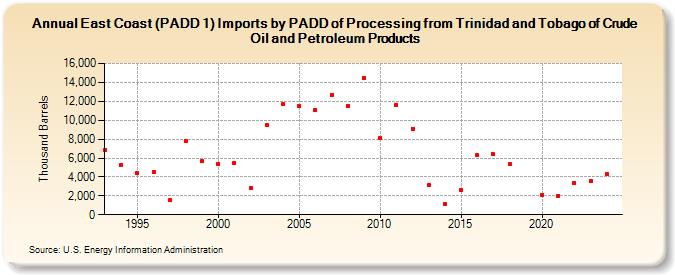
| East Coast (PADD 1) Imports by PADD of Processing from Trinidad and Tobago of Crude Oil and Petroleum Products (Thousand Barrels) | ||||||||
| Decade | Year-0 | Year-1 | Year-2 | Year-3 | Year-4 | Year-5 | Year-6 | Year-7 | Year-8 | Year-9 |
|---|---|---|---|---|---|---|---|---|---|---|
| 1990's | 6,847 | 5,262 | 4,443 | 4,548 | 1,505 | 7,792 | 5,702 | |||
| 2000's | 5,339 | 5,511 | 2,879 | 9,472 | 11,675 | 11,505 | 11,089 | 12,658 | 11,512 | 14,443 |
| 2010's | 8,162 | 11,622 | 9,099 | 3,110 | 1,111 | 2,608 | 6,280 | 6,380 | 5,314 | |
| 2020's | 2,138 | 2,010 | 3,362 | 3,536 | 4,304 |
| - = No Data Reported; -- = Not Applicable; NA = Not Available; W = Withheld to avoid disclosure of individual company data. |
| Release Date: 6/30/2025 |
| Next Release Date: 8/29/2025 |