|
Download Data (XLS File) |
|
||||||||
|
||||||||
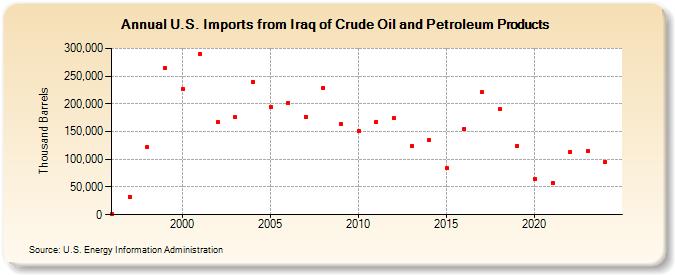
| U.S. Imports from Iraq of Crude Oil and Petroleum Products (Thousand Barrels) | ||||||||
| Decade | Year-0 | Year-1 | Year-2 | Year-3 | Year-4 | Year-5 | Year-6 | Year-7 | Year-8 | Year-9 |
|---|---|---|---|---|---|---|---|---|---|---|
| 1990's | 423 | 32,530 | 122,518 | 264,764 | ||||||
| 2000's | 226,804 | 289,998 | 167,638 | 175,663 | 240,191 | 193,987 | 201,866 | 176,709 | 229,300 | 164,357 |
| 2010's | 151,619 | 167,690 | 174,080 | 124,403 | 134,642 | 83,726 | 155,122 | 220,499 | 190,108 | 124,284 |
| 2020's | 64,456 | 57,277 | 113,668 | 115,263 |
| - = No Data Reported; -- = Not Applicable; NA = Not Available; W = Withheld to avoid disclosure of individual company data. |
| Release Date: 3/29/2024 |
| Next Release Date: 8/30/2024 |