|
Download Data (XLS File) |
|
||||||||
|
||||||||
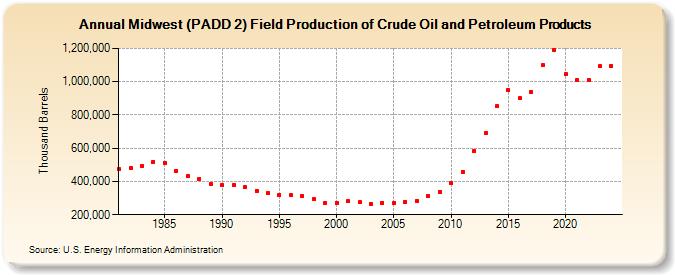
| Midwest (PADD 2) Field Production of Crude Oil and Petroleum Products (Thousand Barrels) | ||||||||
| Decade | Year-0 | Year-1 | Year-2 | Year-3 | Year-4 | Year-5 | Year-6 | Year-7 | Year-8 | Year-9 |
|---|---|---|---|---|---|---|---|---|---|---|
| 1980's | 473,310 | 481,470 | 495,414 | 518,932 | 513,902 | 463,588 | 430,257 | 416,761 | 385,372 | |
| 1990's | 377,720 | 379,270 | 365,840 | 345,021 | 330,478 | 318,597 | 318,381 | 313,649 | 292,490 | 272,318 |
| 2000's | 272,756 | 279,863 | 275,445 | 266,038 | 273,124 | 269,462 | 279,153 | 284,871 | 313,096 | 337,701 |
| 2010's | 392,968 | 459,736 | 583,519 | 690,368 | 852,460 | 949,658 | 900,030 | 940,327 | 1,097,782 | 1,192,064 |
| 2020's | 1,043,853 | 1,007,246 | 1,009,043 | 1,096,484 |
| - = No Data Reported; -- = Not Applicable; NA = Not Available; W = Withheld to avoid disclosure of individual company data. |
| Release Date: 3/29/2024 |
| Next Release Date: 8/30/2024 |