|
Download Data (XLS File) |
|
||||||||
|
||||||||
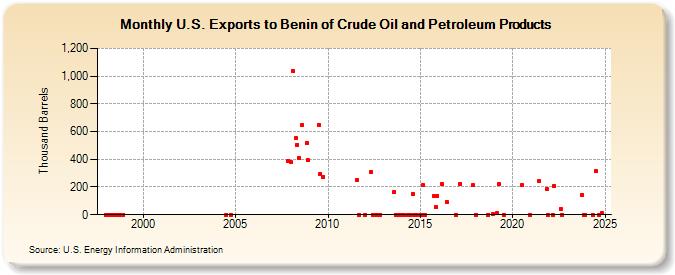
| U.S. Exports to Benin of Crude Oil and Petroleum Products (Thousand Barrels) | ||||||||
| Year | Jan | Feb | Mar | Apr | May | Jun | Jul | Aug | Sep | Oct | Nov | Dec |
|---|---|---|---|---|---|---|---|---|---|---|---|---|
| 1998 | 0 | 0 | 0 | 0 | 1 | 0 | 0 | 0 | 0 | 0 | 0 | 0 |
| 2004 | 0 | 0 | ||||||||||
| 2007 | 387 | |||||||||||
| 2008 | 377 | 1,039 | 551 | 505 | 406 | 646 | 518 | 392 | ||||
| 2009 | 650 | 296 | 274 | |||||||||
| 2011 | 254 | 0 | ||||||||||
| 2012 | 0 | 311 | 0 | 0 | 0 | 0 | ||||||
| 2013 | 166 | 0 | 0 | 0 | 0 | |||||||
| 2014 | 0 | 0 | 0 | 0 | 149 | 0 | 1 | |||||
| 2015 | 0 | 0 | 212 | 0 | 136 | 55 | 136 | |||||
| 2016 | 222 | 90 | 0 | |||||||||
| 2017 | 224 | 212 | ||||||||||
| 2018 | 0 | 0 | 4 | |||||||||
| 2019 | 10 | 220 | 0 | |||||||||
| 2020 | 212 | 0 | ||||||||||
| 2021 | 241 | 182 | 0 | |||||||||
| 2022 | 1 | 208 | 44 | 0 | ||||||||
| 2023 | 145 | 0 | 0 | |||||||||
| 2024 | 0 | |||||||||||
| - = No Data Reported; -- = Not Applicable; NA = Not Available; W = Withheld to avoid disclosure of individual company data. |
| Release Date: 8/30/2024 |
| Next Release Date: 9/30/2024 |