|
Download Data (XLS File) |
|
||||||||
|
||||||||
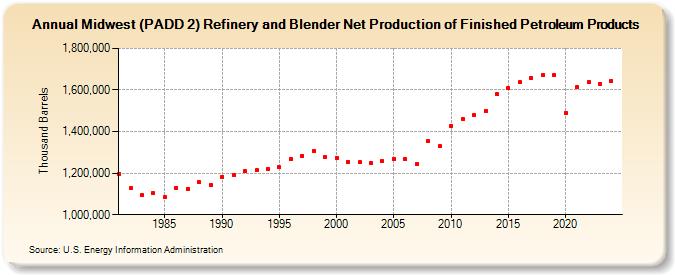
| Midwest (PADD 2) Refinery and Blender Net Production of Finished Petroleum Products (Thousand Barrels) | ||||||||
| Decade | Year-0 | Year-1 | Year-2 | Year-3 | Year-4 | Year-5 | Year-6 | Year-7 | Year-8 | Year-9 |
|---|---|---|---|---|---|---|---|---|---|---|
| 1980's | 1,198,071 | 1,126,511 | 1,094,028 | 1,102,397 | 1,084,399 | 1,130,056 | 1,125,480 | 1,156,369 | 1,143,169 | |
| 1990's | 1,183,571 | 1,192,561 | 1,207,953 | 1,212,693 | 1,220,731 | 1,227,376 | 1,268,353 | 1,283,540 | 1,307,302 | 1,275,753 |
| 2000's | 1,273,072 | 1,255,202 | 1,251,819 | 1,248,771 | 1,258,092 | 1,269,461 | 1,265,771 | 1,242,768 | 1,353,637 | 1,329,333 |
| 2010's | 1,426,965 | 1,460,413 | 1,479,191 | 1,501,214 | 1,578,939 | 1,608,592 | 1,636,108 | 1,657,424 | 1,674,021 | 1,671,716 |
| 2020's | 1,489,799 | 1,613,270 | 1,636,270 | 1,628,864 |
| - = No Data Reported; -- = Not Applicable; NA = Not Available; W = Withheld to avoid disclosure of individual company data. |
| Release Date: 3/29/2024 |
| Next Release Date: 8/30/2024 |