|
Download Data (XLS File) |
|
||||||||
|
||||||||
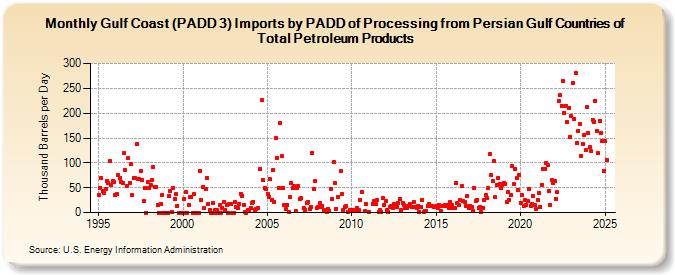
| Gulf Coast (PADD 3) Imports by PADD of Processing from Persian Gulf Countries of Total Petroleum Products (Thousand Barrels per Day) | ||||||||
| Year | Jan | Feb | Mar | Apr | May | Jun | Jul | Aug | Sep | Oct | Nov | Dec |
|---|---|---|---|---|---|---|---|---|---|---|---|---|
| 1995 | 36 | 49 | 70 | 43 | 39 | 47 | 63 | 59 | 104 | 56 | 64 | 61 |
| 1996 | 35 | 37 | 75 | 69 | 61 | 60 | 119 | 86 | 54 | 109 | 59 | 97 |
| 1997 | 35 | 70 | 69 | 137 | 68 | 67 | 84 | 66 | 23 | 50 | 0 | 62 |
| 1998 | 49 | 56 | 66 | 91 | 52 | 51 | 15 | 0 | 18 | 35 | 0 | 0 |
| 1999 | 0 | 0 | 34 | 44 | 2 | 49 | 28 | 37 | 14 | 0 | 0 | 0 |
| 2000 | 0 | 27 | 41 | 0 | 16 | 31 | 31 | 0 | 37 | 0 | 0 | 0 |
| 2001 | 84 | 25 | 52 | 9 | 47 | 70 | 18 | 5 | 0 | 20 | 0 | 6 |
| 2002 | 6 | 0 | 15 | 0 | 10 | 22 | 6 | 15 | 0 | 18 | 18 | 0 |
| 2003 | 0 | 21 | 11 | 9 | 18 | 38 | 34 | 16 | 2 | 0 | 6 | 6 |
| 2004 | 10 | 19 | 22 | 6 | 8 | 9 | 88 | 226 | 66 | 49 | 48 | |
| 2005 | 38 | 31 | 67 | 26 | 86 | 22 | 150 | 109 | 50 | 180 | 113 | 50 |
| 2006 | 15 | 7 | 16 | 2 | 31 | 59 | 49 | 53 | 3 | 50 | 53 | 27 |
| 2007 | 29 | 10 | 6 | 20 | 22 | 7 | 12 | 120 | 48 | 63 | 10 | |
| 2008 | 11 | 19 | 12 | 13 | 6 | 6 | 2 | 8 | 4 | 48 | 27 | 102 |
| 2009 | 59 | 8 | 31 | 83 | 38 | 5 | 11 | 14 | 2 | 6 | ||
| 2010 | 5 | 5 | 3 | 9 | 5 | 26 | 42 | 3 | 17 | |||
| 2011 | 2 | 17 | 23 | 17 | 25 | 1 | 6 | 2 | 30 | 16 | ||
| 2012 | 24 | 6 | 2 | 11 | 13 | 10 | 17 | 12 | 19 | 28 | 5 | |
| 2013 | 20 | 15 | 10 | 10 | 14 | 18 | 12 | 21 | 12 | 9 | 13 | |
| 2014 | 1 | 12 | 26 | 2 | 3 | 3 | 13 | 17 | 13 | 13 | 12 | 12 |
| 2015 | 14 | 9 | 15 | 3 | 13 | 13 | 16 | 13 | 15 | 10 | 21 | 15 |
| 2016 | 9 | 10 | 60 | 19 | 16 | 25 | 54 | 23 | 22 | 14 | 33 | 10 |
| 2017 | 14 | 11 | 3 | 49 | 24 | 26 | 10 | 11 | 1 | 10 | 25 | 35 |
| 2018 | 29 | 50 | 117 | 75 | 63 | 103 | 31 | 55 | 69 | 57 | 50 | 56 |
| 2019 | 60 | 58 | 21 | 41 | 26 | 35 | 93 | 57 | 88 | 69 | 46 | 75 |
| 2020 | 20 | 35 | 14 | 25 | 15 | 24 | 48 | 14 | 17 | 33 | 15 | 7 |
| 2021 | 25 | 40 | 12 | 56 | 87 | 88 | 100 | 95 | 44 | 15 | 65 | 60 |
| 2022 | 63 | 28 | 41 | 224 | 236 | 215 | 265 | 201 | 215 | 182 | 211 | 153 |
| 2023 | 195 | 261 | 189 | 281 | 140 | 165 | 179 | 114 | 138 | 156 | 125 | 212 |
| 2024 | 160 | 131 | 123 | 187 | ||||||||
| - = No Data Reported; -- = Not Applicable; NA = Not Available; W = Withheld to avoid disclosure of individual company data. |
| Release Date: 6/28/2024 |
| Next Release Date: 7/31/2024 |