|
Download Data (XLS File) |


|
||||||||
|
||||||||
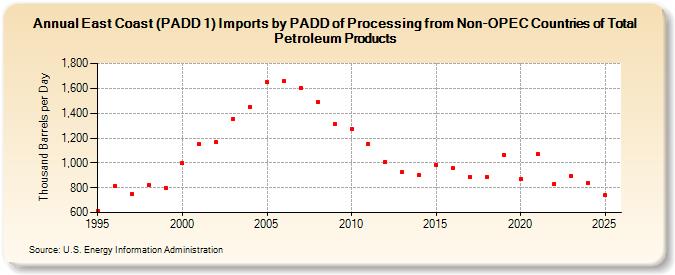
| East Coast (PADD 1) Imports by PADD of Processing from Non-OPEC Countries of Total Petroleum Products (Thousand Barrels per Day) | ||||||||
| Decade | Year-0 | Year-1 | Year-2 | Year-3 | Year-4 | Year-5 | Year-6 | Year-7 | Year-8 | Year-9 |
|---|---|---|---|---|---|---|---|---|---|---|
| 1990's | 614 | 816 | 750 | 818 | 800 | |||||
| 2000's | 998 | 1,153 | 1,167 | 1,356 | 1,452 | 1,647 | 1,660 | 1,604 | 1,490 | 1,312 |
| 2010's | 1,273 | 1,154 | 1,009 | 924 | 899 | 985 | 957 | 890 | 888 | 1,065 |
| 2020's | 869 | 1,072 | 832 | 893 |
| - = No Data Reported; -- = Not Applicable; NA = Not Available; W = Withheld to avoid disclosure of individual company data. |
| Release Date: 8/30/2024 |
| Next Release Date: 8/29/2025 |