|
Download Data (XLS File) |
|
||||||||
|
||||||||
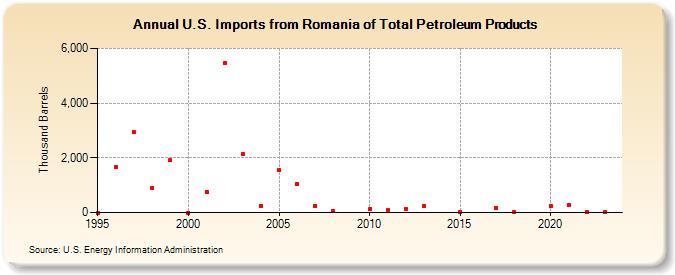
| U.S. Imports from Romania of Total Petroleum Products (Thousand Barrels) | ||||||||
| Decade | Year-0 | Year-1 | Year-2 | Year-3 | Year-4 | Year-5 | Year-6 | Year-7 | Year-8 | Year-9 |
|---|---|---|---|---|---|---|---|---|---|---|
| 1990's | 0 | 1,652 | 2,944 | 893 | 1,907 | |||||
| 2000's | 0 | 762 | 5,464 | 2,157 | 245 | 1,539 | 1,040 | 239 | 49 | |
| 2010's | 130 | 83 | 140 | 224 | 15 | 182 | 30 | |||
| 2020's | 254 | 272 | 9 | 7 |
| - = No Data Reported; -- = Not Applicable; NA = Not Available; W = Withheld to avoid disclosure of individual company data. |
| Release Date: 6/30/2025 |
| Next Release Date: 8/29/2025 |
Referring Pages: