|
Download Data (XLS File) |
|
||||||||
|
||||||||
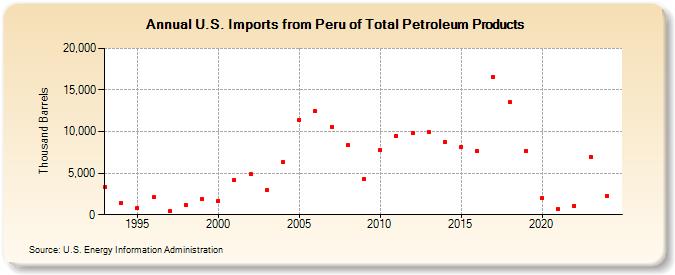
| U.S. Imports from Peru of Total Petroleum Products (Thousand Barrels) | ||||||||
| Decade | Year-0 | Year-1 | Year-2 | Year-3 | Year-4 | Year-5 | Year-6 | Year-7 | Year-8 | Year-9 |
|---|---|---|---|---|---|---|---|---|---|---|
| 1990's | 3,297 | 1,462 | 780 | 2,094 | 401 | 1,152 | 1,890 | |||
| 2000's | 1,696 | 4,151 | 4,878 | 2,935 | 6,289 | 11,423 | 12,412 | 10,586 | 8,339 | 4,312 |
| 2010's | 7,788 | 9,525 | 9,856 | 9,921 | 8,730 | 8,146 | 7,710 | 16,605 | 13,494 | 7,711 |
| 2020's | 2,011 | 661 | 1,094 | 6,996 |
| - = No Data Reported; -- = Not Applicable; NA = Not Available; W = Withheld to avoid disclosure of individual company data. |
| Release Date: 6/28/2024 |
| Next Release Date: 8/30/2024 |
Referring Pages: