|
Download Data (XLS File) |
|
||||||||
|
||||||||
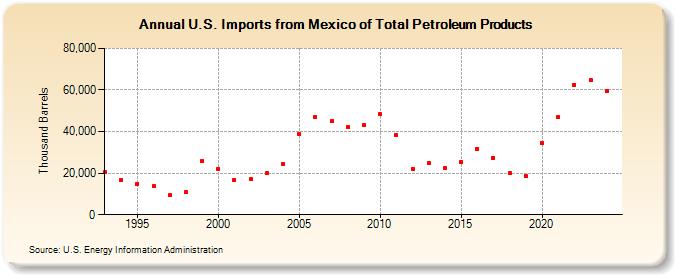
| U.S. Imports from Mexico of Total Petroleum Products (Thousand Barrels) | ||||||||
| Decade | Year-0 | Year-1 | Year-2 | Year-3 | Year-4 | Year-5 | Year-6 | Year-7 | Year-8 | Year-9 |
|---|---|---|---|---|---|---|---|---|---|---|
| 1990's | 20,322 | 16,536 | 14,948 | 13,774 | 9,335 | 10,913 | 25,730 | |||
| 2000's | 22,040 | 16,842 | 17,054 | 19,894 | 24,202 | 38,796 | 46,907 | 45,180 | 42,026 | 43,124 |
| 2010's | 48,263 | 38,200 | 21,977 | 24,911 | 22,310 | 25,493 | 31,816 | 27,271 | 19,840 | 18,621 |
| 2020's | 34,629 | 46,766 | 62,457 | 64,786 |
| - = No Data Reported; -- = Not Applicable; NA = Not Available; W = Withheld to avoid disclosure of individual company data. |
| Release Date: 3/29/2024 |
| Next Release Date: 8/30/2024 |
Referring Pages: