|
Download Data (XLS File) |
|
||||||||
|
||||||||
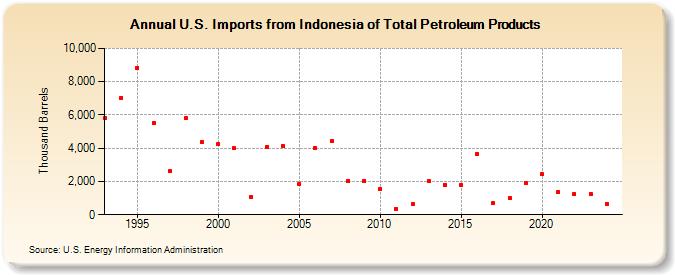
| U.S. Imports from Indonesia of Total Petroleum Products (Thousand Barrels) | ||||||||
| Decade | Year-0 | Year-1 | Year-2 | Year-3 | Year-4 | Year-5 | Year-6 | Year-7 | Year-8 | Year-9 |
|---|---|---|---|---|---|---|---|---|---|---|
| 1990's | 5,822 | 7,033 | 8,840 | 5,515 | 2,624 | 5,825 | 4,362 | |||
| 2000's | 4,266 | 4,004 | 1,074 | 4,090 | 4,115 | 1,848 | 4,028 | 4,438 | 2,047 | 2,046 |
| 2010's | 1,558 | 359 | 628 | 2,002 | 1,787 | 1,769 | 3,652 | 698 | 995 | 1,900 |
| 2020's | 2,419 | 1,371 | 1,246 | 1,236 |
| - = No Data Reported; -- = Not Applicable; NA = Not Available; W = Withheld to avoid disclosure of individual company data. |
| Release Date: 3/29/2024 |
| Next Release Date: 8/30/2024 |