|
Download Data (XLS File) |
|
||||||||
|
||||||||
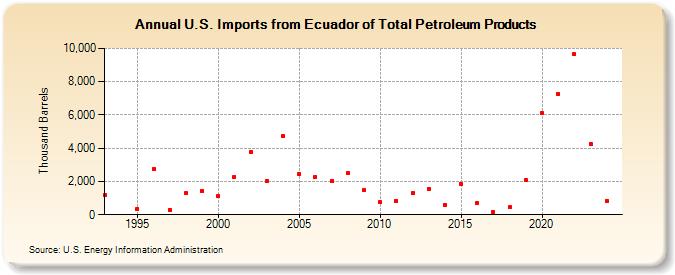
| U.S. Imports from Ecuador of Total Petroleum Products (Thousand Barrels) | ||||||||
| Decade | Year-0 | Year-1 | Year-2 | Year-3 | Year-4 | Year-5 | Year-6 | Year-7 | Year-8 | Year-9 |
|---|---|---|---|---|---|---|---|---|---|---|
| 1990's | 1,156 | 373 | 2,757 | 312 | 1,289 | 1,452 | ||||
| 2000's | 1,136 | 2,273 | 3,771 | 2,026 | 4,703 | 2,423 | 2,274 | 2,041 | 2,480 | 1,461 |
| 2010's | 740 | 842 | 1,295 | 1,561 | 614 | 1,874 | 706 | 184 | 438 | 2,061 |
| 2020's | 6,109 | 7,285 | 9,643 | 4,255 |
| - = No Data Reported; -- = Not Applicable; NA = Not Available; W = Withheld to avoid disclosure of individual company data. |
| Release Date: 8/30/2024 |
| Next Release Date: 8/29/2025 |
Referring Pages: