|
Download Data (XLS File) |
|
||||||||
|
||||||||
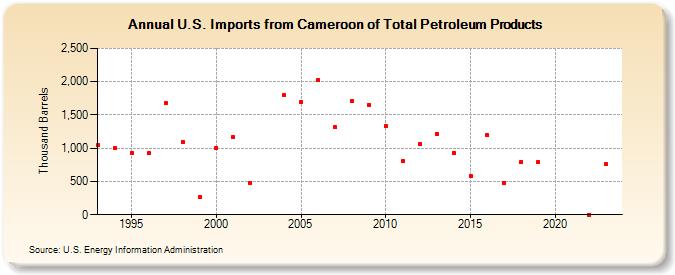
| U.S. Imports from Cameroon of Total Petroleum Products (Thousand Barrels) | ||||||||
| Decade | Year-0 | Year-1 | Year-2 | Year-3 | Year-4 | Year-5 | Year-6 | Year-7 | Year-8 | Year-9 |
|---|---|---|---|---|---|---|---|---|---|---|
| 1990's | 1,041 | 1,002 | 927 | 921 | 1,675 | 1,095 | 261 | |||
| 2000's | 1,004 | 1,164 | 483 | 1,792 | 1,699 | 2,027 | 1,312 | 1,715 | 1,656 | |
| 2010's | 1,331 | 803 | 1,060 | 1,215 | 933 | 580 | 1,196 | 477 | 791 | 793 |
| 2020's | 1 | 762 |
| - = No Data Reported; -- = Not Applicable; NA = Not Available; W = Withheld to avoid disclosure of individual company data. |
| Release Date: 4/30/2024 |
| Next Release Date: 8/30/2024 |